2020-09-01 15:00:00


U.S. GAS PRODUCTION DOWN ANEW
U.S. EIA - August 31, 2020 - Data for June 2020
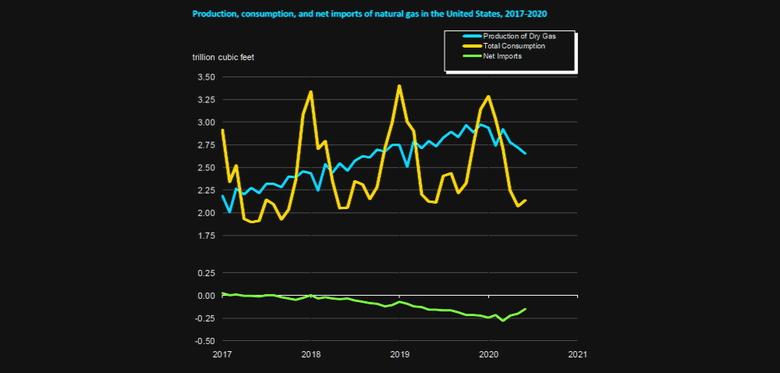
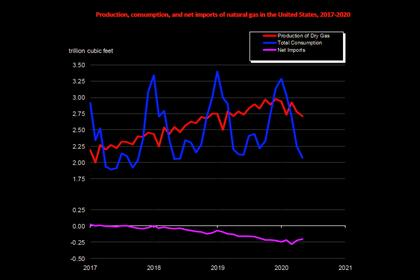
- In June 2020, for the second consecutive month, dry natural gas production decreased year to year for the month. The preliminary level for dry natural gas production in June 2020 was 2,650 billion cubic feet (Bcf), or 88.3 Bcf/d. This level was 2.9 Bcf/d (-3.1%) lower than the June 2019 level of 91.2 Bcf/d. Despite this year-to-year decrease, the average daily rate of dry production was the second highest for the month since the U.S. Energy Information Administration (EIA) began tracking monthly dry production in 1973.
- Estimated natural gas consumption in June 2020 was 2,134 Bcf, or 71.1 Bcf/d. This level was 0.6 Bcf/d (0.9%) higher than the 70.5 Bcf/d consumed in June 2019. The average daily rate of natural gas consumption for June 2020 was the highest for the month since EIA began using the current definitions for consuming sectors in 2001.
- The year-over-year average daily rate of consumption of dry natural gas in June 2020 increased in two of the four consuming sectors, and it decreased in the other two. Deliveries of natural gas by consuming sector in June 2020 were as follows:
- Residential deliveries: 136 Bcf for the month, or 4.5 Bcf/d
• Up 5.4% compared with 4.3 Bcf/d in June 2019. Residential deliveries were the highest for the month since 2009. - Commercial deliveries: 133 Bcf for the month, or 4.4 Bcf/d • Down 8.3% compared with 4.8 Bcf/d in June 2019. Commercial deliveries were the lowest for the month since 2012.
- Industrial deliveries: 604 Bcf for the month, or 20.1 Bcf/d • Down 4.6% compared with 21.1 Bcf/d in June 2019. Industrial deliveries were the lowest for the month since 2016.
- Electric power deliveries: 1,047 Bcf for the month, or 34.9 Bcf/d • Up 5.4% compared with 33.1 Bcf/d in June 2019. Electric power deliveries were the highest for the month since EIA began using the current definitions for consuming sectors in 2001.
- Residential deliveries: 136 Bcf for the month, or 4.5 Bcf/d
- Net natural gas imports (imports minus exports) were -153 Bcf, or -5.1 Bcf/d, in June 2020, making the United States a net exporter. Natural gas imports and exports in June 2020 were as follows:
-
Total imports: 185 Bcf for the month, or 6.2 Bcf/d
• Down 8.0% compared with 6.7 Bcf/d in June 2019. The average daily rate of natural gas imports was the lowest for the month since 1993.
-
Total exports: 338 Bcf for the month, or 11.3 Bcf/d
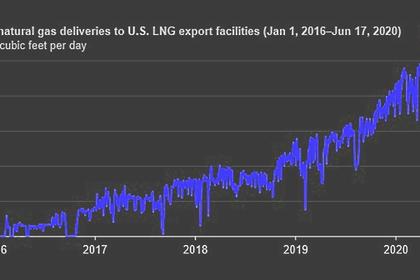
• Down 6.1% compared with 12.0 Bcf/d in June 2019, the first year-to-year decrease for any month since October 2014. Despite this year-to-year decrease, the average daily rate of natural gas exports was the second highest for the month since EIA began tracking monthly exports in 1973. Liquefied natural gas (LNG) had been driving the year-on-year increase in exports since 2016. However, LNG exports in June 2020 were down 23.2% compared with June 2019, the first year-to-year decrease for any month since January 2016. In June 2020, the United States exported 3.6 Bcf/d of LNG to 17 countries, down from 27 countries in May 2020. Furthermore, about 46 LNG cargoes from the United States were canceled in June, as global LNG suppliers have reduced shipments in response to a decline in LNG demand worldwide.See a recent Today in Energy article about
- for more information.
-
-----
Earlier:
2020, August, 28, 15:05:00
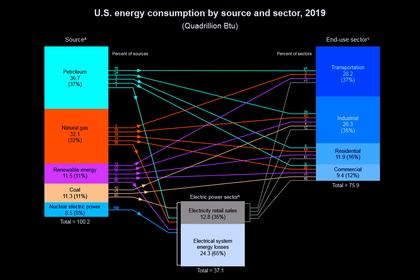
U.S. ENERGY CONSUMPTION: TWICE
U.S. leaky, inefficient homes produce nearly one-fifth of the country’s energy-related greenhouse gas emissions, a number that has probably crept higher as the pandemic has kept people at home.
2020, August, 18, 12:30:00
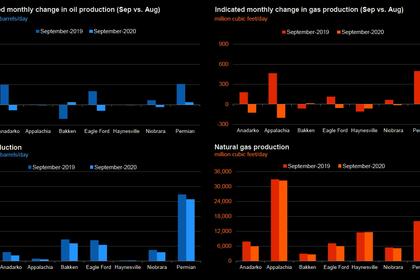
U.S. PRODUCTION: OIL (-19) TBD, GAS (-421) MCFD
Crude oil production from the major US onshore regions is forecast to decrease 19,000 b/d month-over-month in August from 7,577 to 7,558 thousand barrels/day, gas production to decrease 421 million cubic feet/day from 79,684 to 79,263 million cubic feet/day .
2020, August, 14, 11:55:00
U.S. LNG EXPORTS DOWN
U.S. exports of LNG fell to an average of 3.1 Bcf/d in July 2020.
2020, August, 3, 12:40:00
U.S. GAS PRODUCTION DOWN
The U.S. preliminary level for dry natural gas production in May 2020 was 2,713 billion cubic feet (Bcf), or 87.5 Bcf/d.
2020, July, 30, 12:20:00
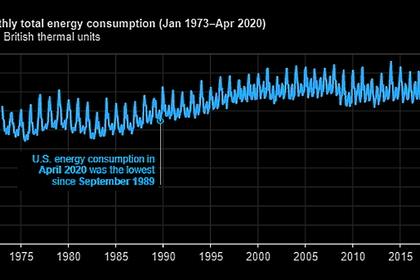
U.S. ENERGY CONSUMPTION DOWN
the United States consumed 6.5 quadrillion British thermal units of energy in April 2020,


