2020-09-04 12:05:00


U.S. INTERNATIONAL TRADE DEFICIT $63.6 BLN
U.S. BEA - September 3, 2020 - U.S. International Trade in Goods and Services, July 2020
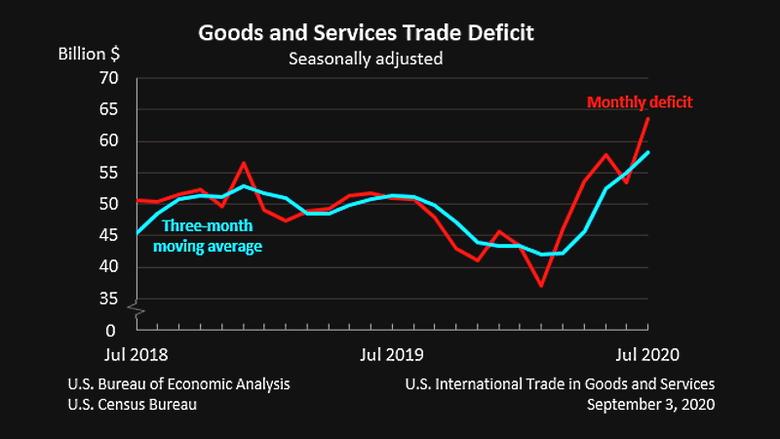
The U.S. Census Bureau and the U.S. Bureau of Economic Analysis announced today that the goods and services deficit was $63.6 billion in July, up $10.1 billion from $53.5 billion in June, revised.
| Deficit: | $63.6 Billion | +18.9%° |
| Exports: | $168.1 Billion | +8.1%° |
| Imports: | $231.7 Billion | +10.9%° |
|
Next release: October 6, 2020 (°) Statistical significance is not applicable or not measurable. Data adjusted for seasonality but not price changes Source: U.S. Census Bureau, U.S. Bureau of Economic Analysis; U.S. International Trade in Goods and Services, September 3, 2020 |
||
Exports, Imports, and Balance (exhibit 1)
July exports were $168.1 billion, $12.6 billion more than June exports. July imports were $231.7 billion, $22.7 billion more than June imports.
The July increase in the goods and services deficit reflected an increase in the goods deficit of $9.3 billion to $80.9 billion and a decrease in the services surplus of $0.8 billion to $17.4 billion.
Year-to-date, the goods and services deficit increased $6.4 billion, or 1.8 percent, from the same period in 2019. Exports decreased $257.8 billion or 17.5 percent. Imports decreased $251.3 billion or 13.8 percent.
Three-Month Moving Averages (exhibit 2)
The average goods and services deficit increased $3.3 billion to $58.3 billion for the three months ending in July.
- Average exports increased $6.9 billion to $155.1 billion in July.
- Average imports increased $10.2 billion to $213.4 billion in July.
Year-over-year, the average goods and services deficit increased $6.9 billion from the three months ending in July 2019.
- Average exports decreased $55.7 billion from July 2019.
- Average imports decreased $48.8 billion from July 2019.
Exports (exhibits 3, 6, and 7)
Exports of goods increased $12.3 billion to $115.5 billion in July.
Exports of goods on a Census basis increased $12.3 billion.
- Automotive vehicles, parts, and engines increased $3.8 billion.
- Passenger cars increased $2.1 billion.
- Consumer goods increased $2.6 billion.
- Gem diamonds increased $0.7 billion.
- Artwork, antiques, and other collectibles increased $0.6 billion.
- Industrial supplies and materials increased $2.5 billion.
- Crude oil increased $1.1 billion.
- Other petroleum products increased $0.4 billion.
- Capital goods increased $2.5 billion.
- Semiconductors increased $0.8 billion.
- Civilian aircraft engines increased $0.5 billion.
Net balance of payments adjustments decreased less than $0.1 billion.
Exports of services increased $0.4 billion to $52.6 billion in July.
- Other business services increased $0.3 billion.
- Transport increased $0.3 billion.
- Charges for the use of intellectual property increased $0.1 billion.
- Travel decreased $0.4 billion.
Imports (exhibits 4, 6, and 8)
Imports of goods increased $21.5 billion to $196.4 billion in July.
Imports of goods on a Census basis increased $21.5 billion.
- Automotive vehicles, parts, and engines increased $7.7 billion.
- Passenger cars increased $3.7 billion.
- Automotive parts and accessories increased $2.5 billion.
- Industrial supplies and materials increased $4.4 billion.
- Finished metal shapes increased $1.3 billion.
- Nonmonetary gold increased $0.9 billion.
- Crude oil increased $0.7 billion.
- Capital goods increased $4.1 billion.
- Civilian aircraft increased $1.7 billion.
- Electric apparatus increased $0.4 billion.
- Generators and accessories increased $0.4 billion.
- Consumer goods increased $3.5 billion.
- Cell phones and other household goods increased $1.7 billion.
- Cotton apparel and household goods increased $0.7 billion.
- Furniture and household items increased $0.7 billion.
Net balance of payments adjustments increased $0.1 billion.
Imports of services increased $1.2 billion to $35.3 billion in July.
- Transport increased $0.5 billion.
- Travel increased $0.3 billion.
- Charges for the use of intellectual property increased $0.1 billion.
- Insurance services increased $0.1 billion.
Real Goods in 2012 Dollars – Census Basis (exhibit 11)
The real goods deficit increased $10.1 billion to $90.5 billion in July.
- Real exports of goods increased $13.1 billion to $133.7 billion.
- Real imports of goods increased $23.2 billion to $224.2 billion.
Revisions
Exports and imports of goods and services were revised for January through June 2020 to incorporate more comprehensive and updated quarterly and monthly data.
Revisions to June exports
- Exports of goods were revised up $0.3 billion.
- Exports of services were revised down $3.1 billion.
Revisions to June imports
- Imports of goods were revised down $0.2 billion.
- Imports of services were revised up $0.2 billion.
Goods by Selected Countries and Areas: Monthly – Census Basis (exhibit 19)
The July figures show surpluses, in billions of dollars, with South and Central America ($2.9), OPEC ($1.5), Hong Kong ($1.4), Brazil ($0.8), United Kingdom ($0.6), and Saudi Arabia ($0.3). Deficits were recorded, in billions of dollars, with China ($28.3), European Union ($13.1), Mexico ($11.5), Japan ($3.4), Germany ($3.0), Taiwan ($2.8), France ($2.5), India ($2.0), Italy ($1.8), South Korea ($1.5), Singapore ($1.0), and Canada ($0.5).
- The deficit with Mexico increased $2.5 billion to $11.5 billion in July. Exports increased $2.4 billion to $17.8 billion and imports increased $4.9 billion to $29.3 billion.
- The deficit with China increased $1.6 billion to $28.3 billion in July. Exports increased $0.1 billion to $9.5 billion and imports increased $1.7 billion to $37.8 billion.
- The surplus with South and Central America increased $1.2 billion to $2.9 billion in July. Exports increased $1.3 billion to $9.7 billion and imports increased $0.1 billion to $6.8 billion.
Goods and Services by Selected Countries and Areas: Quarterly – Balance of Payments Basis (exhibit 20)
Statistics on trade in goods and services by country and area are only available quarterly, with a one-month lag. With this release, second-quarter figures are now available.
The second-quarter figures show surpluses, in billions of dollars, with South and Central America ($13.0), OPEC ($6.4), United Kingdom ($4.0), Brazil ($3.4), Saudi Arabia ($1.9), Hong Kong ($1.6), Canada ($0.6), and Singapore ($0.2). Deficits were recorded, in billions of dollars, with China ($75.8), European Union ($24.8), Mexico ($15.0), Germany ($12.4), Japan ($6.9), Taiwan ($6.7), India ($6.4), Italy ($4.9), South Korea ($4.5), and France ($2.7).
- The deficit with China increased $21.4 billion to $75.8 billion in the second quarter. Exports increased $2.5 billion to $36.8 billion and imports increased $23.9 billion to $112.6 billion.
- The surplus with South and Central America decreased $8.1 billion to $13.0 billion in the second quarter. Exports decreased $21.9 billion to $46.4 billion and imports decreased $13.8 billion to $33.4 billion.
- The deficit with Mexico decreased $13.2 billion to $15.0 billion in the second quarter. Exports decreased $25.7 billion to $43.2 billion and imports decreased $38.9 billion to $58.2 billion.
-----
Earlier:
2020, August, 28, 15:25:00
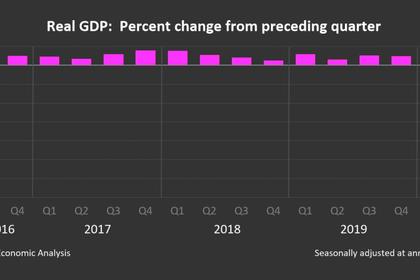
U.S. GDP DOWN 31.7%
U.S. real gross domestic product (GDP) decreased at an annual rate of 31.7 percent in the second quarter of 2020
2020, August, 28, 15:20:00
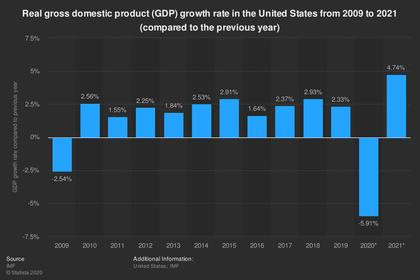
U.S. GDP WILL DOWN 6.6%
the U.S. financial system has been resilient in the face of the recent economic and financial shock.

2020, August, 26, 12:55:00
U.S. ECONOMY RECESSION
The U.S. economy slipped into recession in February. Gross domestic product contracted in the second quarter at its steepest pace in at least 73 years.
2020, August, 17, 12:30:00
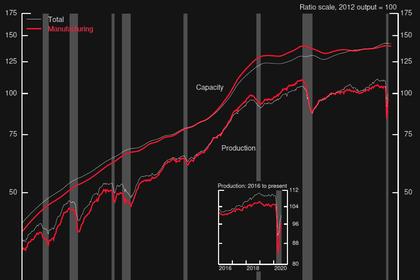
U.S. INDUSTRIAL PRODUCTION UP
The U.S. total industrial production rose 3.0 percent in July after increasing 5.7 percent in June

2020, August, 13, 13:30:00
U.S. BUDGET DEFICIT $2.81 TLN
The U.S. budget deficit climbed to $2.81 trillion in the first 10 months of the budget year,


