2020-09-03 12:45:00


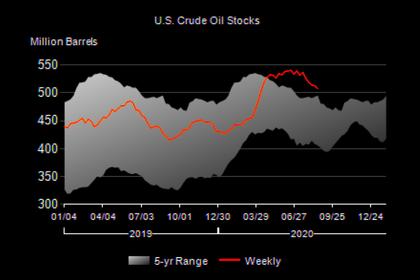
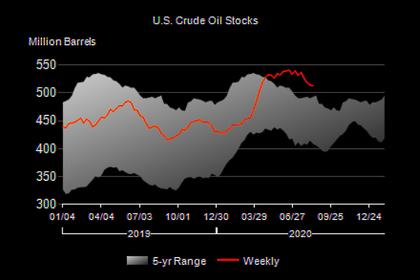
U.S. OIL INVENTORIES DOWN BY 9.4 MB TO 498.4 MB
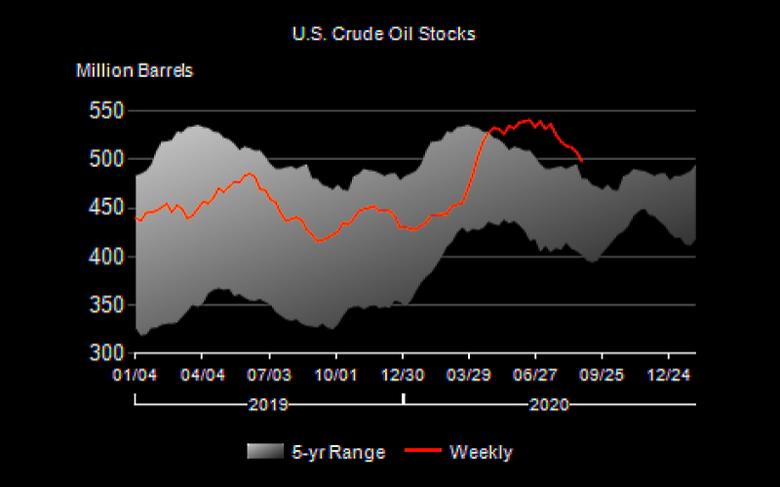
U.S. EIA - Sept. 2, 2020 - Data for week ending August 28, 2020
Summary of Weekly Petroleum Status Report
U.S. crude oil refinery inputs averaged 13.9 million barrels per day during the week ending August 28, 2020 which was 0.8 million barrels per day
less than the previous week’s average. Refineries operated at 76.7% of their operable capacity last week. Gasoline production increased last week, averaging 9.5 million barrels per day. Distillate fuel production decreased last week, averaging 4.8 million barrels per day.
U.S. crude oil imports averaged 4.9 million barrels per day last week, decreased by 1.0 million barrels per day from the previous week. Over the past four weeks, crude oil imports averaged about 5.5 million barrels per day, 20.2% less than the same four-week period last year. Total motor gasoline imports (including both finished gasoline and gasoline blending components) last week averaged 577,000 barrels per day, and distillate fuel imports averaged 166,000 barrels per day.
U.S. commercial crude oil inventories (excluding those in the Strategic Petroleum Reserve) decreased by 9.4 million barrels from the previous week. At 498.4 million barrels, U.S. crude oil inventories are about 14% above the five year average for this time of year. Total motor gasoline inventories decreased by 4.3 million barrels last week and are about 4% above the five year average for this time of year. Finished gasoline inventories increased while blending components inventories decreased last week. Distillate fuel inventories decreased by 1.7 million barrels last week and are about 23% above the five year average for this time of year. Propane/propylene inventories increased by 4.4 million barrels last week and are about 11% above the five year average for this time of year. Total commercial petroleum inventories decreased by 7.8 million barrels last week.
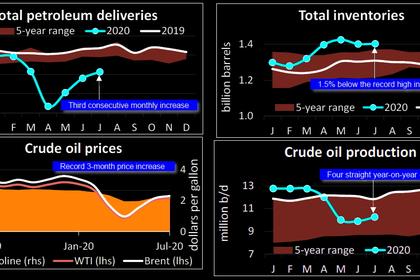
Total products supplied over the last four-week period averaged 18.3 million barrels a day, down by 15.9% from the same period last year. Over the past four weeks, motor gasoline product supplied averaged 8.9 million barrels a day, down by 8.9% from the same period last year. Distillate fuel product supplied averaged 3.7 million barrels a day over the past four weeks, down by 5.1% from the same period last year. Jet fuel product supplied was down 47.1% compared with the same fourweek period last year.
The West Texas Intermediate crude oil price was $42.96 per barrel on August 28, 2020, $0.64 above last week’s price but $12.11 less than a year ago. The spot price for conventional gasoline in the New York Harbor was $1.284 per gallon, $0.013 more than last week’s price but $0.359 below a year ago. The spot price for ultra-low sulfur diesel fuel in the New York Harbor was $1.204 per gallon, $0.001 above last week’s price but $0.622 under a year ago.
The national average retail regular gasoline price was $2.222 per gallon on August 31, 2020, $0.040 per gallon higher than last week’s price but $0.341 under a year ago. The national average retail diesel fuel price was $2.441 per gallon, $0.015 per gallon above last week’s level but $0.535 under a year ago.
-----
Earlier:

2020, August, 31, 12:05:00
U.S. RIGS UP 0 TO 254
U.S. Rig Count is unchanged from last week at 254, Canada Rig Count is down 2 rigs from last week to 54
2020, August, 27, 13:50:00
U.S. OIL INVENTORIES DOWN BY 4.7 MB TO 507.8 MB
U.S. commercial crude oil inventories decreased by 4.7 million barrels to 507.8 million barrels,
2020, August, 26, 12:45:00
U.S. OIL MARKET UPDOWN
“Although the market remains uncertain, we saw encouraging signs in July with gradual rebalancing of oil supply and demand,” API Chief Economist Dean Forman said. “Increases in U.S. refinery throughput and capacity utilization in July – coupled with inventories receding from record highs – has reinforced expectations for the continued demand recovery.”

2020, August, 24, 12:15:00
U.S. RIGS UP 10 TO 254
U.S. Rig Count is up 10 from last week at 254, Canada Rig Count is up 2 rigs from last week to 56
2020, August, 20, 14:35:00
U.S. OIL INVENTORIES DOWN BY 1.6 MB TO 512.5 MB
U.S. commercial crude oil inventories decreased by 1.6 million barrels to 512.5 million barrels,
2020, August, 18, 12:30:00
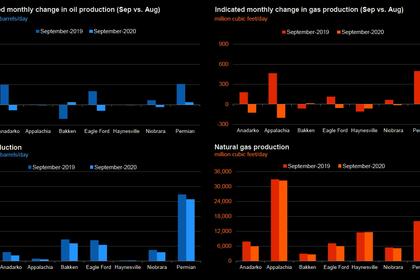
U.S. PRODUCTION: OIL (-19) TBD, GAS (-421) MCFD
Crude oil production from the major US onshore regions is forecast to decrease 19,000 b/d month-over-month in August from 7,577 to 7,558 thousand barrels/day, gas production to decrease 421 million cubic feet/day from 79,684 to 79,263 million cubic feet/day .

2020, August, 13, 13:35:00
U.S. OIL INVENTORIES DOWN BY 4.5 MB TO 514.1 MB
U.S. commercial crude oil inventories decreased by 4.5 million barrels to 514.1 million barrels,


