2021-01-11 12:30:00


THE NEW U.S. RENEWABLES UP 71%
By Ken Bossong Executive Director SUN DAY Campaign
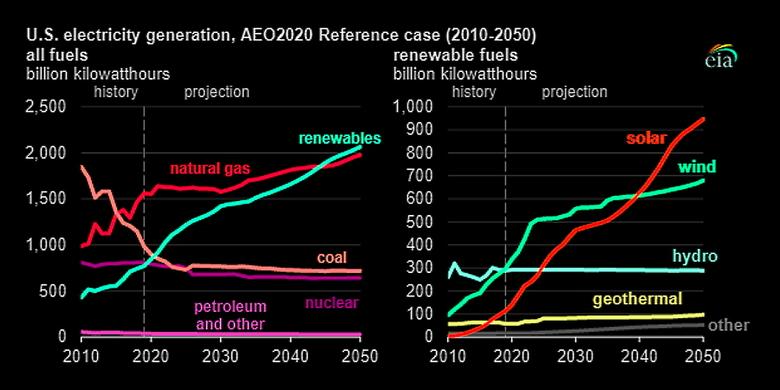
ENERGYCENTRAL - Jan 7, 2021 - According to a review by the SUN DAY Campaign of data just released by the Federal Energy Regulatory Commission (FERC), renewable energy sources (i.e., biomass, geothermal, hydropower, solar, wind) have dominated new U.S. electrical generating capacity additions in the first eleven months of 2020.
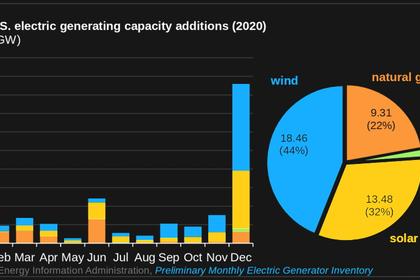
Combined, they accounted for almost 71% (14,734 MW) of the 20,803 MW of new utility-scale capacity reported to have been added thus far in 2020. Year-to-date, wind (8,042 MW) and solar (6,485 MW) have each contributed more new generating capacity than has natural gas (6,039 MW). [1]
FERC's latest monthly "Energy Infrastructure Update" report (with data through November 30, 2020) also reveals that natural gas accounted for 29.0% of the total, with very small contributions by coal (20 MW), oil (5 MW), and "other" sources (5 MW) providing the balance. There have been no new capacity additions by nuclear power or geothermal energy since the beginning of the year.
Moreover, all of the new generating capacity added during the past six months (i.e., June through November) was provided by wind (2,987 MW), solar (2,218 MW), and hydropower (24 MW). In November alone, all new U.S. utility-scale electrical generation capacity added was attributable to five new “units” of wind (882 MW) and ten units of solar (626 MW).
Renewable energy sources now account for 23.52% of the nation’s total available installed generating capacity and continue to expand their lead over coal (19.97%). Wind's share (9.42%) of generating capacity has now surpassed that of nuclear power (8.61%) while solar (4.16%) has edged out oil (3.31%). The generating capacity of wind and solar is now 13.58% of the nation’s total … and that does not include distributed (e.g., rooftop) solar. [2]
For perspective, five years ago, FERC reported that installed renewable energy generating capacity was 17.53% of the nation's total with wind at 6.03% (now 9.42%) and solar at 1.16% (now 4.16%). By comparison, in August 2015, coal's share was 26.42% (now 19.97 %), nuclear was 9.18% (now 8.61%), and oil was 3.86% (now 3.31%). Only natural gas has shown any growth among non-renewable sources - expanding modestly from a 42.84% share five years ago to 44.41% today.
In addition, FERC data suggest that renewables’ share of generating capacity is on track to increase significantly over the next three years (i.e., by November 2023). “High probability” generation capacity additions for wind, minus anticipated retirements, reflect a projected net increase of 27,622 MW while solar is foreseen growing by even more - 32,784 MW. By comparison, net growth for natural gas will be only 21,489 MW. Thus, wind and solar combined are forecast to provide nearly three times as much new generating capacity as natural gas over the next three years.
While hydropower, geothermal, and biomass also are all projected to experience net growth (1,018 MW, 178 MW, and 105 MW respectively), the generating capacities of coal and oil are projected to plummet - by 22,621 MW and 5,055 MW respectively. In fact, FERC reports no new coal capacity in the pipeline over the next three years and just 6 MW of new oil-based capacity. Nuclear power is likewise forecast to drop sharply - by 4,330 MW, or more than 4% of its currently operating capacity.
In total, the mix of all renewables will add more than 61,707 MW of net new generating capacity to the nation’s total by November 2023 while the net new capacity from natural gas, coal, oil, and nuclear power combined will actually drop by more than 10,500 MW .
If FERC's projections prove accurate, over the next three years, renewable energy generating capacity should account for comfortably more than a quarter of the nation's total available installed generating capacity - increasing from 23.52% today to 27.46% three years hence. Meanwhile, coal's share will drop to 17.37% (from 19.97% today), nuclear to 7.92% (from 8.61%), and oil to 2.78% (from 3.31%). Natural gas' share will also dip slightly to 44.31%, compared to 44.41% now.
In fact, renewables’ share could - and probably will - be even higher. Over the past 22 months, FERC has been regularly increasing its renewable energy projections in the monthly “Infrastructure” reports. FERC's first such projection - provided in its March 2019 report - forecast the addition of 24,560 MW of wind and 12,048 MW of solar during the ensuing three years. In its most recent report, those forecasts had grown to 27,622 MW of new wind capacity and 32,784 MW of new solar over the next three years.
Moreover, FERC's data also outline a second - albeit less probable - scenario for even higher net additions by solar (128,001 MW) and wind (86,435 MW) which would be more than four times those projected for natural gas (49,226 MW).
"FERC's projections for strong growth by renewable energy sources, especially solar and wind, may very well prove to be unduly modest," noted Ken Bossong, Executive Director of the SUN DAY Campaign. "With a very supportive incoming Biden Administration, coupled with Democratic majorities in the U.S. Senate and House of Representatives, this trend should not only continue but rapidly accelerate during the next few years."
# # # # # # # # #
[1] Capacity is not the same as actual generation. Capacity factors for nuclear power and fossil fuels tend to be higher than those for most renewables. For example, for calendar year 2019, the U.S. Energy Information Administration (EIA) reported that renewables accounted for 18.2% of the nation's total electrical generation - that is, somewhat less than was their share of installed generating capacity (22.1%) for the same period. Conversely, coal's share of generating capacity in 2019 was 20.9% while its share of electrical generation was 23.3%.
[2] FERC generally only reports data for utility-scale facilities (i.e., those rated 1-MW or greater) and therefore its data do not reflect the capacity of distributed renewables, notably rooftop solar PV which - according to the EIA - accounts for nearly a third of the nation's electrical generation by solar. That would suggest that the total of distributed and utility-scale solar capacity combined may be as much as 50% higher than the solar capacity of 4.2% reported by FERC -- i.e., closer to 6%.
Sources:
FERC's 6-page "Energy Infrastructure Update for November 2020" was released on January 5, 2021. It can be found at https://www.ferc.gov; open the link "Industries and Data," then follow to "FERC Staff Reports and Papers," and then to "Energy Infrastructure." For the information cited in this update, see the tables entitled "New Generation In-Service (New Build and Expansion)," "Total Available Installed Generating Capacity," and "Generation Capacity Additions and Retirements."
The U.S. Energy Information Administration issued its "Electric Power Monthly" report for calendar year 2019 on February 26, 2020. It may be found at: https://www.eia.gov/electricity/monthly
Follow the link to "previous issues" and then to "December 2019". The data cited in this update can be found at, or extrapolated from, Tables ES1.A and ES1.B.
-----
This thought leadership article was originally shared with Energy Central's Clean Power Community Group. The communities are a place where professionals in the power industry can share, learn and connect in a collaborative environment. Join the Clean Power Community today and learn from others who work in the industry.
-----
Earlier:
2020, December, 25, 10:25:00
U.S. RENEWABLES STUMULUS $2 TLN
$35 billion in funding for clean energy research across different types of technologies
2020, December, 24, 13:15:00
U.S. NUCLEAR ENERGY - 2021: $1.5 BLN
The total appropriation for the Department of Energy (DOE) is USD42.04 billion, which is USD3.45 billion above the FY2020-enacted level and USD6.31 billion above the budget request.
2020, December, 22, 13:35:00
U.S. SOLAR POWER UP
Solar wholesale power sales totaled 18.3 million MWh in Q3, compared to 15 million MWh in Q3 2019.
2020, December, 22, 13:20:00
U.S. HYDROGEN ENERGY
Renewable gases and zero-carbon hydrogen will play a key role in decarbonizing the US natural gas distribution system and the industry's environmental stewardship,

2020, December, 17, 13:20:00
U.S. SOLAR ENERGY UP BY 3.8 GW
The US brought live 3.8 GW of solar photovoltaic (PV) capacity in the third quarter of 2020, and is seen to reach 19 GW of annual installations.
2020, December, 7, 12:50:00
U.S. RENEWABLES ELECTRICITY UP
Renewable energy sources (i.e., biomass, geothermal, hydropower, solar, wind) continued to expand their share of the nation's electricity production during the first three-quarters of 2020,


