2021-01-15 11:40:00


U.S. GAS PRODUCTION UPDOWN
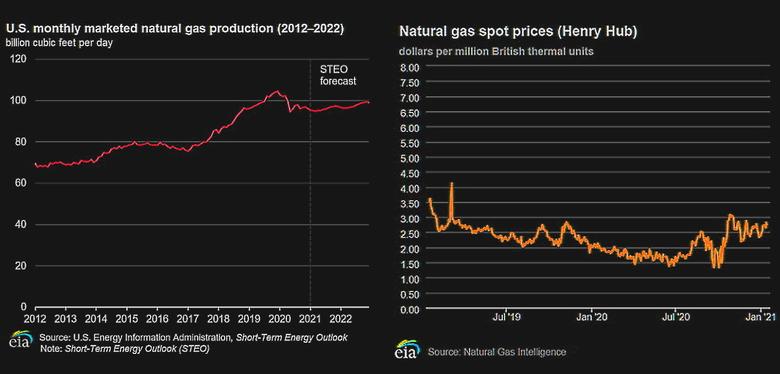
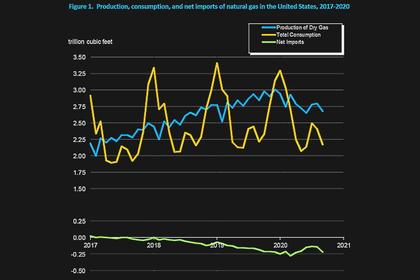
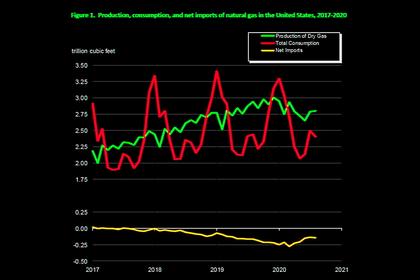
U.S. EIA - JANUARY 13, 2021 - In its January Short-Term Energy Outlook (STEO), EIA estimates that annual U.S. marketed gas production for 2021 will fall 2% and average 96.2 billion cubic feet per day (Bcf/d). However, in 2022, EIA estimates that natural gas production will rise by 2% compared with year-ending 2021 production of 98.2 Bcf/d, accompanied by rising natural gas prices.
The United States set annual natural gas production records in 2018 and 2019, largely based on increased drilling in shale and tight oil formations. This increased production led to higher volumes of natural gas in storage and a corresponding decrease in natural gas prices. In 2020, the supply and demand contraction as a result of the COVID-19 pandemic resulted in marketed natural gas production decreasing by 2% from 2019 levels.
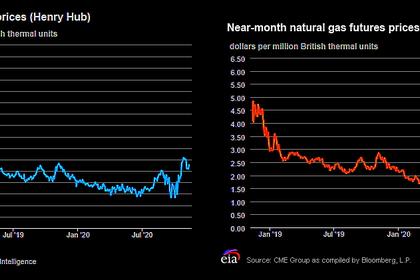
The January STEO also forecasts associated gas production from oil wells in the Permian Basin to fall because of a lower West Texas Intermediate (WTI) crude oil price and reduced drilling activity in the early months of 2021. As the WTI price increases, associated gas production will likely rise with it. Natural gas production from predominantly natural gas regions such as the Appalachia Basin is closely tied to the Henry Hub price. EIA estimates that the Henry Hub price will gradually rise from an average $2.03 per million British thermal units (MMBtu) in 2020 to more than $3.00/MMBtu in 2022. The increase in the Henry Hub price is likely to result in a rise in natural gas production in Appalachia. However, natural gas production in Appalachia may reach its takeaway capacity constraints in 2021 if the Mountain Valley Pipeline (MVP), scheduled to enter service in late 2021, is delayed. MVP is the only active pipeline project planned to come online in 2021 that will add significant takeaway capacity from the Appalachia region.
-----
Earlier:
2021, January, 12, 11:30:00
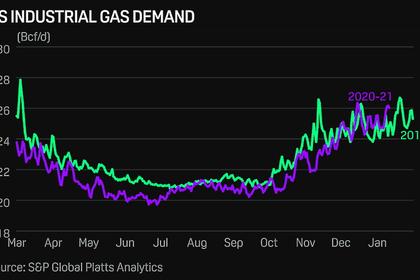
U.S. INDUSTRIAL GAS DEMAND UP
Over the past six weeks, the growth in US industrial gas demand has been fueled in large part by industries in the Northeast, Texas and the Southeast, which together account for over 60% of US industrial gas consumption.
2021, January, 8, 15:20:00
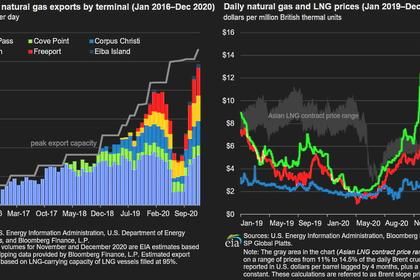
U.S. LNG EXPORTS 9.8 BCFD
U.S. exports of liquefied natural gas (LNG) set a new record in December after a record-breaking November 2020, averaging 9.8 billion cubic feet per day (Bcf/d),
2020, December, 15, 14:10:00
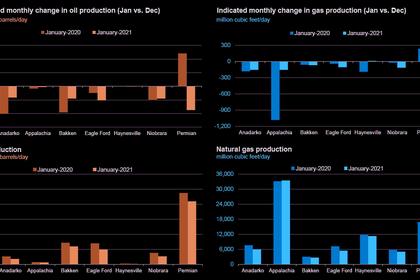
U.S. PRODUCTION: OIL (-137) TBD, GAS (-744) MCFD
Crude oil production from the major US onshore regions is forecast to decrease 137,000 b/d month-over-month in December from 7,575 to 7,438 thousand barrels/day, gas production to decrease 744 million cubic feet/day from 81,521 to 80,777 million cubic feet/day .
2020, December, 1, 13:20:00
U.S. GAS PRODUCTION DOWN ANEW
The preliminary level for dry natural gas production in September 2020 was 2,678 billion cubic feet (Bcf), or 89.3 Bcf/d. This level was 5.4 Bcf/d (-5.7%) lower than the September 2019 level of 94.7 Bcf/d.
2020, November, 17, 13:00:00
U.S. GAS INVENTORIES UP
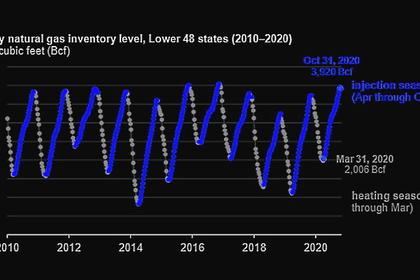
The amount of working natural gas in storage in the United States ended the natural gas injection, or refill, season (April 1–October 31) at 3,920 billion cubic feet (Bcf),
2020, November, 13, 13:15:00
U.S. GAS PRICES UP TO $3
the natural gas spot price at the Henry Hub reached $3.00 per million British thermal units (MMBtu), its highest value since March 2019,
2020, November, 2, 17:15:00
U.S. GAS PRODUCTION DOWN
The preliminary level for dry natural gas production in August 2020 was 2,801 billion cubic feet (Bcf), or 90.4 Bcf/d. This level was 4.5 Bcf/d (-4.7%) lower than the August 2019 level of 94.8 Bcf/d.


