2021-01-08 15:15:00


U.S. INTERNATIONAL TRADE DEFICIT UP TO $68 BLN
U.S. BEA - January 7, 2021 - U.S. International Trade in Goods and Services, November 2020
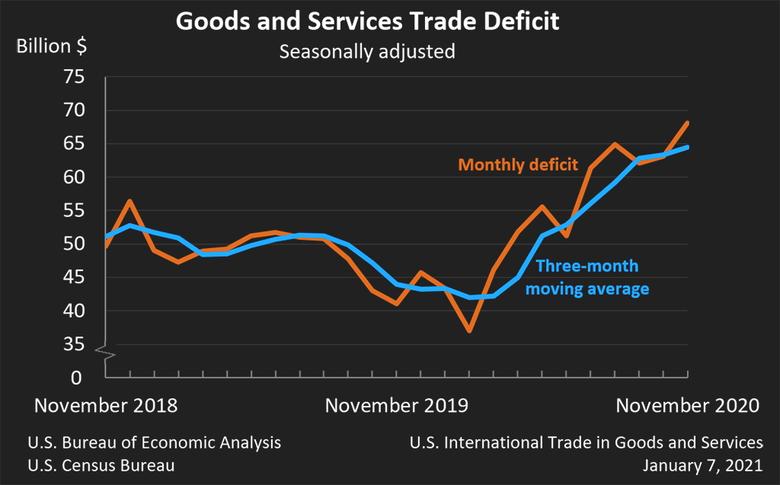
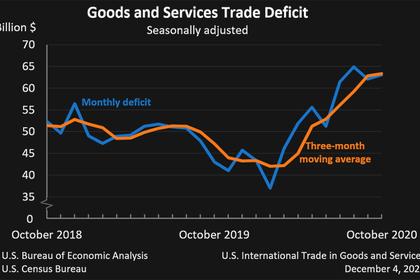
The U.S. Census Bureau and the U.S. Bureau of Economic Analysis announced today that the goods and services deficit was $68.1 billion in November, up $5.0 billion from $63.1 billion in October, revised.
| Deficit: |
$68.1 Billion |
+8.0%° |
| Exports: |
$184.2 Billion |
+1.2%° |
| Imports: |
$252.3 Billion |
+2.9%° |
|
Next release: February 5, 2021 (°) Statistical significance is not applicable or not measurable. Data adjusted for seasonality but not price changes Source: U.S. Census Bureau, U.S. Bureau of Economic Analysis; U.S. International Trade in Goods and Services, January 7, 2021 |
||
Exports, Imports, and Balance (exhibit 1)
November exports were $184.2 billion, $2.2 billion more than October exports. November imports were $252.3 billion, $7.2 billion more than October imports.
The November increase in the goods and services deficit reflected an increase in the goods deficit of $5.0 billion to $86.4 billion and a decrease in the services surplus of less than $0.1 billion to $18.2 billion.
Year-to-date, the goods and services deficit increased $73.6 billion, or 13.9 percent, from the same period in 2019. Exports decreased $372.3 billion or 16.1 percent. Imports decreased $298.7 billion or 10.5 percent.
Three-Month Moving Averages (exhibit 2)
The average goods and services deficit increased $1.1 billion to $64.4 billion for the three months ending in November.
- Average exports increased $3.4 billion to $181.4 billion in November.
- Average imports increased $4.5 billion to $245.9 billion in November.
Year-over-year, the average goods and services deficit increased $20.5 billion from the three months ending in November 2019.
- Average exports decreased $28.7 billion from November 2019.
- Average imports decreased $8.2 billion from November 2019.
Exports (exhibits 3, 6, and 7)
Exports of goods increased $1.3 billion to $127.7 billion in November.
Exports of goods on a Census basis increased $1.3 billion.
- Industrial supplies and materials increased $0.8 billion.Foods, feeds, and beverages increased $0.5 billion.
- Natural gas increased $0.5 billion.
- Foods, feeds, and beverages increased $0.5 billion.
Net balance of payments adjustments increased less than $0.1 billion.
Exports of services increased $0.9 billion to $56.4 billion in November.
- Travel increased $0.5 billion.
- Transport increased $0.3 billion.
Imports (exhibits 4, 6, and 8)
Imports of goods increased $6.3 billion to $214.1 billion in November.
Imports of goods on a Census basis increased $6.4 billion.
- Consumer goods increased $4.0 billion.Industrial supplies and materials increased $1.5 billion.
- Cell phones and other household goods increased $2.8 billion.
- Industrial supplies and materials increased $1.5 billion.
- Capital goods increased $1.2 billion.
- Automotive vehicles, parts, and engines decreased $1.0 billion.
- Passenger cars decreased $1.1 billion.
Net balance of payments adjustments decreased $0.1 billion.
Imports of services increased $0.9 billion to $38.2 billion in November.
- Transport increased $0.4 billion.
- Travel increased $0.4 billion.
Real Goods in 2012 Dollars – Census Basis (exhibit 11)
The real goods deficit increased $6.7 billion to $96.5 billion in November.
- Real exports of goods increased $0.7 billion to $144.6 billion.
- Real imports of goods increased $7.4 billion to $241.1 billion.
Revisions
Revisions to October exports
- Exports of goods were revised up $0.1 billion.
- Exports of services were revised down $0.1 billion.
Revisions to October imports
- Imports of goods were revised up less than $0.1 billion.
- Imports of services were revised down less than $0.1 billion.
Goods by Selected Countries and Areas: Monthly – Census Basis (exhibit 19)
The November figures show surpluses, in billions of dollars, with South and Central America ($3.0), Hong Kong ($1.8), OPEC ($1.2), Brazil ($1.2), United Kingdom ($1.1), Saudi Arabia ($0.2), and Singapore ($0.2). Deficits were recorded, in billions of dollars, with China ($30.0), European Union ($16.7), Mexico ($11.3), Japan ($6.6), Germany ($4.9), Italy ($3.5), Taiwan ($3.0), South Korea ($2.9), India ($2.4), Canada ($1.7), and France ($1.7).
- The deficit with China increased $3.5 billion to $30.0 billion in November. Exports decreased $0.5 billion to $12.6 billion and imports increased $3.0 billion to $42.6 billion.
- The deficit with the European Union increased $1.0 billion to $16.7 billion in November. Exports increased $0.9 billion to $20.4 billion and imports increased $2.0 billion to $37.1 billion.
- The surplus with South and Central America increased $0.8 billion to $3.0 billion in November. Exports increased $0.2 billion to $11.0 billion and imports decreased $0.6 billion to $8.0 billion.
-----
Earlier:
2020, December, 23, 12:50:00
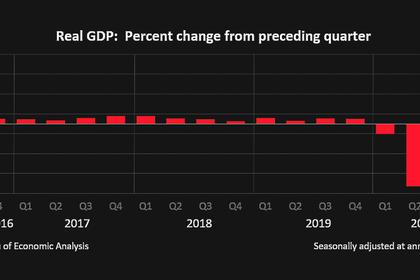
U.S. GDP UP 33.4%
U.S. real gross domestic product (GDP) increased at an annual rate of 33.4 percent in the third quarter of 2020
2020, December, 21, 12:35:00
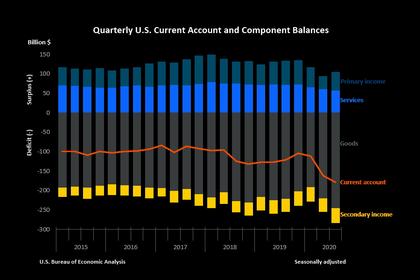
U.S. CURRENT ACCOUNT DEFICIT UP TO $178.5 BLN
The U.S. current account deficit, which reflects the combined balances on trade in goods and services and income flows between U.S. residents and residents of other countries, widened by $17.2 billion, or 10.6 percent, to $178.5 billion in the third quarter of 2020
2020, December, 17, 13:40:00
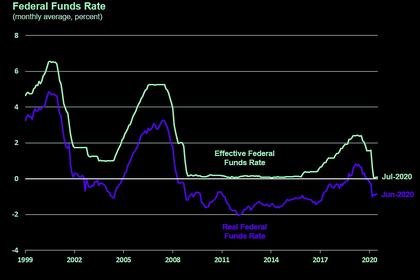
U.S. FEDERAL FUNDS RATE 0.0 - 0.25% AGAIN
The Committee decided to keep the target range for the federal funds rate at 0 to 1/4 percent
2020, December, 16, 12:20:00
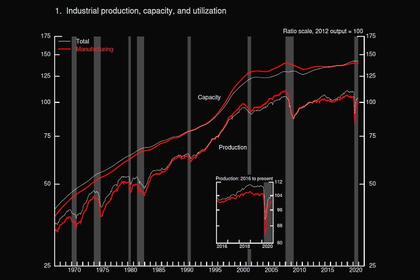
U.S. INDUSTRIAL PRODUCTION INCREASED
U.S. industrial production increased 0.4 percent in November.
2020, December, 7, 13:05:00
U.S. INTERNATIONAL TRADE DEFICIT UP TO $63 BLN
the U.S. goods and services deficit was $63.1 billion in October, up $1.0 billion from $62.1 billion in September


