2021-11-12 12:35:00


GLOBAL OIL DEMAND 2021: + 5.7 MBD
OPEC - 11 November 2021 - OPEC MONTHLY OIL MARKET REPORT
Oil Market Highlights
Crude Oil Price Movements
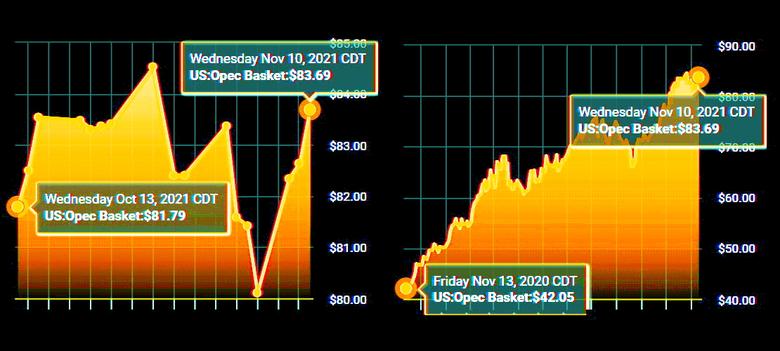
Crude oil spot prices surged by more than 12% in October, on the back of soaring energy prices in Europe and Asia. Strong oil market fundamentals, compounded by expectations of higher oil demand in the winter months from “gas to oil switching”, have supported both spot and futures prices. The OPEC Reference Basket (ORB) increased $8.23 or 11.1%, m-o-m, in October to average $82.11/b. Year-to-date, the ORB averaged $68.33/b, for a gain of $27.77, or 68.4%, compared to the same period last year. In the futures market, the ICE Brent front-month contract rose $8.87 or 11.8%, m-o-m, to average $83.75/b in October, while NYMEX WTI increased $9.68 or 13.5%, m-o-m, to average $81.22/b. Consequently, the Brent/WTI spread narrowed by 81¢ to stand at $2.53/b in October. The market structure of all three major oil benchmarks – Brent, WTI and Dubai – strengthened, moving deeper into backwardation on further declines in OECD commercial oil stocks in September and the prospect of stronger near-term market fundamentals. Hedge funds and other money managers boosted bullish positions related to NYMEX WTI in October as data showed ongoing drawdowns in inventories at the Cushing, Oklahoma, trading hub. However, speculators cut bullish positions related to ICE Brent.
World Economy
Global economic growth forecasts for both 2021 and 2022 remain unchanged from the last month’s assessment at 5.6% and 4.2%, respectively. For the US, lower-than-expected economic growth in 3Q21 has resulted in a downward revision for 2021. The US economy is now expected to grow by 5.5% in 2021 and by 4.1% in 2022. Euro-zone economic growth for 2021 is revised up slightly to 5.1%, after continued strong growth in 3Q21, and remains at 3.9% for 2022. Japan’s economic growth forecast for 2021 is revised down slightly to 2.5%, due to ongoing COVID-19-related social-distancing measures in 3Q21, while the forecast for 2022 remains at 2%. After a strong recovery in the first half of the year, China’s economic growth forecast remains at 8.3% in 2021 and 5.8% in 2022. Similarly, India’s economic growth forecast for 2021 is also unchanged at 9% for 2021 and 6.8% for 2022. Russia remains at 4% for 2021 at 2.7% for 2022. Brazil’s economic growth forecast is also unchanged for 2021, but was revised down slightly to 2% for 2022. The ongoing robust growth in the world economy continues to be challenged by uncertainties related to the spread of COVID-19 variants and the pace of vaccine rollouts worldwide, as well as ongoing global supply-chain bottlenecks. Additionally, sovereign debt levels in many regions, together with rising inflationary pressures and potential central bank responses, remain key factors requiring close monitoring.
World Oil Demand
World oil demand growth in 2021 is revised lower by around 0.16 mb/d, compared to last month’s assessment, to stand at 5.7 mb/d. Revisions were mainly to account for slower than anticipated demand from China and India in 3Q21. Global oil demand is now estimated to reach 96.4 mb/d in 2021. For 2022, growth in global oil demand remains unchanged compared to the previous month’s assessment, to stand at 4.2 mb/d. World total demand in 2022 is now estimated to reach 100.6 mb/d, around 0.5 mb/d above 2019 levels. Marginal upward revisions in OECD Europe, due better economic views in some European countries, were offset by softer growth in industrial fuel demand, in OECD America and Latin America.
World Oil Supply
Non-OPEC liquids supply is expected to grow by 0.7 mb/d in 2021, unchanged from last month’s assessment, to average 63.6 mb/d. This is despite a marginal upward revision of 0.02 mb/d from the US, Canada, and Mexico, which were offset by a similar downward adjustment in the non-OECD. The main drivers of 2021 supply growth continue to be Canada, Russia, China, Norway, Brazil and Guyana. The forecast for non-OPEC liquids supply growth in 2022 is also unchanged at 3.0 mb/d to average 66.7 mb/d. Russia and the US are expected to be the main drivers of next year’s growth, contributing increments of 1.0 mb/d and 0.9 mb/d, respectively, followed by Brazil, Canada, Kazakhstan, Norway, Guyana and other countries in the DoC. OPEC NGLs are forecast to grow by 0.1 mb/d both in 2021 and 2022 to average 5.2 mb/d and 5.3 mb/d, respectively. In October, OPEC crude oil production increased by 0.22 mb/d m-o-m, to average 27.45 mb/d, according to available secondary sources.
Product Markets and Refining Operations
Product markets in all main trading hubs retained their previous month’s strength in October, as refining economics continued to trend upwards, posting solid gains. Further declines in refinery processing rates attributable to the peak maintenance season weighed on product inventory levels and continued to keep product balances tight. This drove middle distillates to retain their position as the strongest margin contributors in the Atlantic Basin. In Asia, sustained fuel demand, amid limited product exports from China as refiners focused on supplying the domestic market, provided considerable support to Asian fuel markets, particularly at the top and middle sections of the barrel.
Tanker Market
Dirty tanker spot freight rates gained some positive momentum in October, with increases across all classes. VLCCs and Suezmax enjoyed the highest rates so far this year, with gains averaging 16% and 29%, respectively, m-o-m, while Aframax rates were up 22% m-o-m. For VLCCs, the Middle East-to-East route gained 17% m-o-m. For Suezmax, the West Africa-to-US Gulf Coast increased 35%. In the clean market, spot freight rates strengthened, as a 22% gain West of Suez offset a 6% decline in the East. The tanker market’s performance is likely to improve through the end of the year, as concerns regarding an energy crunch in the power sector over winter support tonnage demand for crude and products, particularly in Asia.
Crude and Refined Products Trade
Preliminary data shows US crude imports in October eased from their summer highs to average 6.1 mb/d, while crude exports averaged 2.8 mb/d, supported by a pickup of flows to Europe. The latest data for September shows China’s crude imports fell back, averaging 10.0 mb/d as independent refiners remained on the sidelines, due to a lack of crude import quotas. In India, crude imports hit a five-month high, averaging 4.3 mb/d in September, as refiners boosted runs amid a recovery in economic activity. Japan’s crude imports declined from the previous month’s peak but still remained at a relatively good level of 2.5 mb/d in September as refiners looked toward preparations for winter. In OECD Europe, the latest data for July shows crude imports remaining strong at 8.6 mb/d, while crude exports continued to edge higher reaching 0.4 mb/d, amid a return of flows to Asia.
Commercial Stock Movements
Preliminary September data sees total OECD commercial oil stocks up by 18.5 mb, m-o-m. At 2,805 mb, inventories were 374 mb lower than the same month last year; 206 mb lower than the latest five-year average; and 163 mb lower than the 2015-2019 average. Within the components, crude and products stocks fell by 9.3 mb and 9.2 mb, m-o-m, respectively. At 1,334 mb, OECD crude stocks stood 118 mb below the latest five-year average and 103 mb below the 2015-2019 average. At 1,471 mb, OECD product stocks stood 89 mb below the latest five-year average, and were 60 mb below the 2015-2019 average. In terms of days of forward cover, OECD commercial stocks fell 0.2 days, m-o-m, in September to stand at 61.5 days. This is 12.4 days lower than the same month last year; 2.8 days below the latest five-year average; and 0.7 days lower than the 2015-2019 average.
Balance of Supply and Demand
Demand for OPEC crude in 2021 was revised slightly down by 0.1 mb/d from the previous month to stand at 27.6 mb/d, around 4.9 mb/d higher than in 2020. Demand for OPEC crude in 2022 was also revised slightly down by 0.1 mb/d from the previous month to stand at 28.7 mb/d, around 1.0 mb/d higher than in 2021.
-----
Earlier:
2021, November, 9, 17:20:00
GLOBAL OIL DEMAND GROWTH
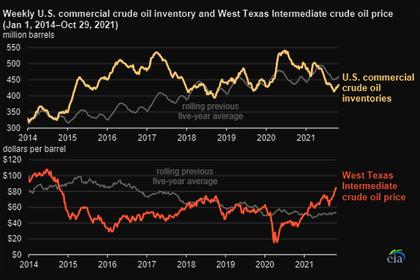
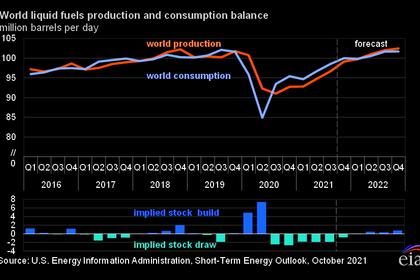
This year, demand for petroleum, both in the United States and globally, has largely returned to the pre-pandemic levels in 2019. Demand has grown faster than supply, reducing inventories and contributing to higher prices for crude oil and petroleum products.
2021, November, 9, 17:15:00
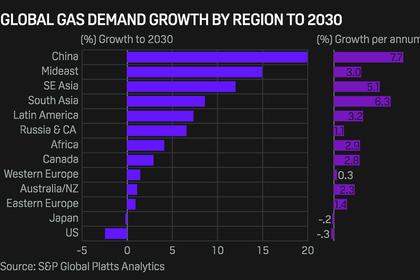
GLOBAL GAS DEMAND GROWTH
"About 50% of the incremental global natural gas demand will come from Asia by 2035, with China and India as the main engines to boost the development of the LNG market," Luo said.
2021, November, 8, 12:05:00
GLOBAL POWER DEMAND GROWTH
The global power market is experiencing rapid power demand growth as markets recover from the pandemic.
2021, October, 19, 12:35:00
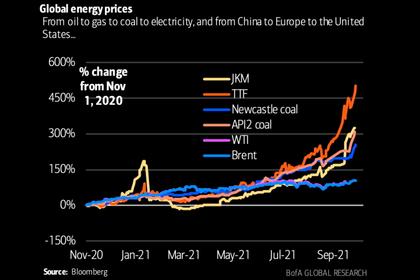
GLOBAL ENERGY PRICES UP
Several factors are fuelling this price surge in energy commodities – primary among them is energy demand having rebounded as economies get back to business and consumers return to pre-pandemic levels of economic activity.
2021, October, 15, 09:35:00
GLOBAL OIL DEMAND WILL UP BY 5.8 MBD
World oil demand is estimated to increase by 5.8 mb/d in 2021, revised down from 5.96 mb/d in the previous month’s assessment.
2021, October, 13, 12:10:00
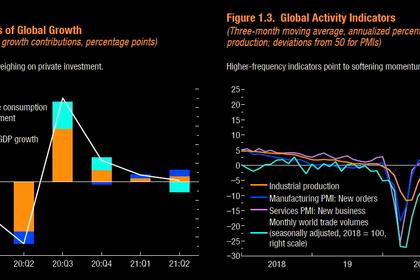
GLOBAL ECONOMY GROWTH 2021-22: 5.9% - 4.9%
The global economy is projected to grow 5.9 percent in 2021 and 4.9 percent in 2022
2021, October, 11, 11:50:00
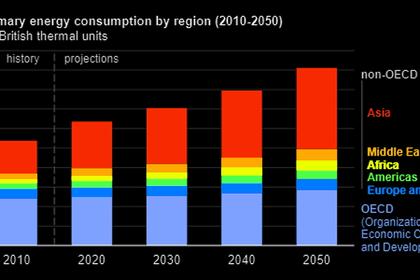
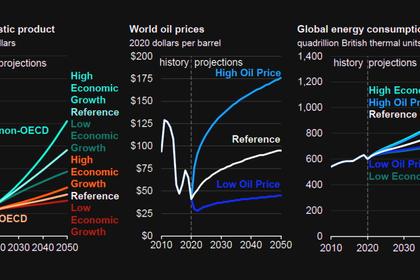
GLOBAL ENERGY CONSUMPTION WILL UP BY 50%
Global energy consumption will increase nearly 50% over the next 30 years.


