2021-11-30 12:50:00


THE NEW U.S. RENEWABLES 88%
By KEN BOSSONG Executive Director SUN DAY Campaign
ENERGYCENTRAL - Nov 23, 2021 - According to a review by the SUN DAY Campaign of data recently released by the Federal Energy Regulatory Commission (FERC), solar, wind, and other renewable energy sources (i.e., biomass, geothermal, hydropower) dominated new U.S. electrical generating capacity additions during the first three-quarters of 2021. [1]
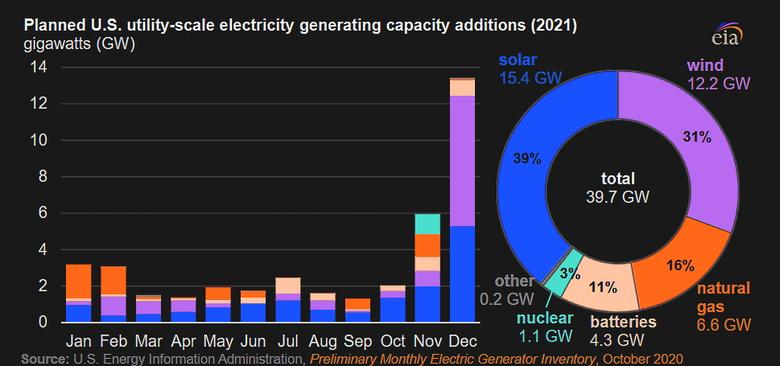
FERC's latest monthly "Energy Infrastructure Update" report (with data through September 30, 2021) reveals that renewable energy sources accounted for 87.61% - or 16,665 megawatts (MW) - of the 19,022 MW of new capacity added during the first nine months of the year. Solar led the capacity additions with 8,410 MW, followed closely by wind (8,188 MW). Compared to the first nine months of 2020, new solar capacity additions are 38.28% higher while those from wind are 34.19% higher. There were also small additions in 2021 by hydropower (28 MW), geothermal (25 MW), and biomass (14 MW).
Most of the balance was provided by natural gas (2,327 MW) coupled with very small contributions from oil (19 MW) and coal (11 MW).
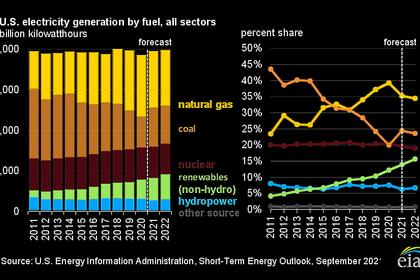
Renewables now provide more than a quarter (25.39%) of total U.S. available installed generating capacity - a share significantly greater than that of coal (18.88%) and more than three times that of nuclear power (8.32%). [1] By comparison, a year ago, renewables' share was only 23.28%. Five years ago, it was 18.46% and a decade earlier it was 14.11%.
That growth is almost entirely attributable to a nearly three-fold increase in wind's share of installed generating capacity and a 37-fold increase in solar's share. Wind is now more than a tenth (10.52%) of the nation's generating capacity (up from 3.79% in September 2011) while utility-scale solar has surpassed five percent (5.14%) - up from 0.14% in September 2011 ... and that does not include distributed (e.g., rooftop) solar. [2]
That growth continues. Wind and solar accounted for 100% of the 915 MW of new capacity additions in September. This included one "unit" of wind - the 288.0 MW Maverick Wind Project in Kingfisher County, OK - as well as 14 units of solar. The latter included the 252.9 MW Prospero Solar I-II Project in Andrews County, TX and the 227.0 MW Muscle Shoals Solar Project in Colbert County, AL.
Moreover, FERC data suggest that the share of generating capacity from solar and wind is on track to increase significantly over the next three years (i.e., by September 2024). FERC notes that there may be as much as 168,601 MW of new solar capacity in the pipeline with 51,758 MW classified as "high probably additions" offset by only 92 MW of projected "retirements." Just a year ago, FERC reported 127,244 MW of solar in the three-year pipeline with 32,801 MW classified as "high probability." In addition, new wind capacity by September 2024 could total 73,453 MW with 22,957 MW being "high probability" and only 151 MW of retirements expected.
“High probability” generation capacity additions for solar and wind combined, minus anticipated retirements, reflect a projected net increase of 74,472 MW. By comparison, net growth for natural gas will be only 14,535 MW. Thus, solar and wind together are forecast to provide more than five times as much new net generating capacity as natural gas over the next three years ... not to mention over 50 times as much net new capacity as nuclear power (just 1,377 MW).
If just FERC's latest "high probability" projections materialize, by September 2024, renewable energy sources should provide over 30 percent (30.04%) of the nation's total available installed generating capacity with utility-scale solar and wind accounting for 8.88% and 11.8% respectively.
"Whether one compares solar's growth to that of last year or a decade ago or three years hence, the conclusion is the same -- it has been, and continues to be, explosive ... and wind has not been far behind," noted Ken Bossong, Executive Director of the SUN DAY Campaign. "And this growth can only accelerate if recent COP26 commitments are kept and the proposed federal Build Back Better legislation is enacted into law."
Earlier:
2021, November, 17, 13:15:00
U.S. CLEAN ENERGY LAW
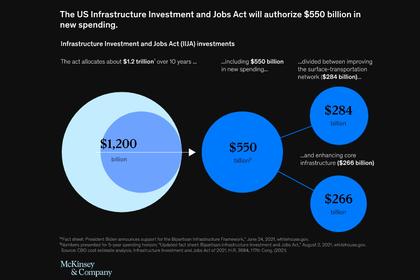
The USD1.2 trillion package is a key part of the president's Build Back Better agenda and contains a total of more than USD62 billion for the US Department of Energy (DOE) to deliver a "more equitable clean energy future", including preventing the premature retirement of existing nuclear plants and investing in advanced nuclear projects.

2021, November, 10, 12:05:00
U.S. ENERGY CLIMATE INVESTMENT $1.2 TLN
The US House of Representatives has passed a US$1,200bn infrastructure bill.
2021, November, 2, 13:30:00
U.S. WIND ENERGY UP
U.S. aims to deploy 30 GW of offshore wind by 2030 and to permit at least 25 GW of onshore renewable energy by 2025.
2021, October, 19, 12:20:00
U.S. ECONOMIC, ENERGY PLAN $3.5 TLN
The most immediate goal of the plan is to push the energy sector to reach at least 80% clean energy output by 2030.
2021, October, 8, 09:55:00
U.S. RENEWABLES RECORD 13%
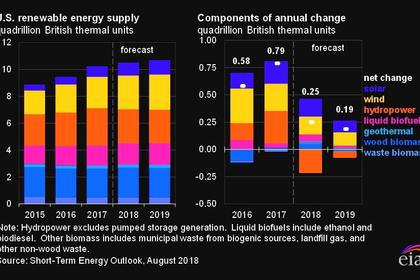
The latest issue of EIA's "Monthly Energy Review" report (with data through June 30, 2021) reveals that renewable sources accounted for 12.91% of the U.S. energy produced (and 12.71% of the energy consumed) for electricity, transportation, heating, and other uses.
2021, September, 13, 12:20:00
U.S. COAL ELECTRICITY UP 34.7%
What fuels increased electricity production year-on-year?
Coal – up 34.7% (112.5 million MWh)
Wind – up 10% (17.4)
Solar – up 29% (12.6)
2021, September, 10, 12:15:00
U.S. SOLAR POWER WILL UP
By 2035, the decarbonization scenarios show cumulative solar deployment of 760–1,000 GW, serving 37%–42% of electricity demand


