2021-02-17 16:00:00


LNG FOR ASIA UP
HSN - 17/02/2021 - Notwithstanding COVID-19, LNG imports by North Asian countries (including Taiwan) increased by 2.5% to a total of 200.3 Mt LNG in 2020, 4.8 Mt higher than in 2019 when 195.5 Mt was imported. Import prices took a hit with the falling oil price. Average Asian import prices dropped 24.1% to US$7.27/MMBtu in 2020 from US$9.57/MMBtu in 2019. Australia’s average price fell 25.8% to US$6.87/MMBtu, down from US$9.26/MMBtu in 2019. Figure 1 shows falling average import prices for the first three quarters of 2020 in the major Asian importing countries. China Pipeline shows the average landed price of natural gas imported by China by pipeline from Central Asia, Russia and Myanmar.
China the world’s biggest gas importer
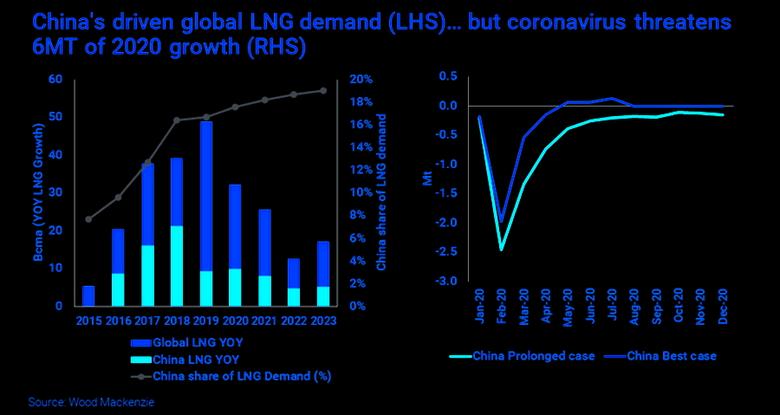
China is far and away the world’s largest gas importer, well ahead of number two, Germany and number three, Japan. China saw the greatest increase in Asian LNG volumes during 2020, importing 67.4 Mt of LNG, up 11.1% on the 60.7 Mt imported in 2019. China’s pipeline gas imports fell 4.9% in 2020 to 34.5 Mt from 36.3 Mt in 2019. Total Chinese gas imports were 101.9 Mt compared to 97.0 Mt in 2019, an increase of 9.5% year on year. However, natural gas still only constituted 8.8% of China’s primary energy consumption, well below the global average of 24%.
Chinese gas demand is expected to continue to grow strongly, particularly replacing coal as the country moves towards its 2060 goal of net zero carbon emissions.
The growth in gas demand in China reflected the strong rebound in industrial activity following the first wave of COVID-19, together with the exceptionally cold winter. Beijing recorded its coldest December day in 42 years.
Pipeline imports from Russia began in December 2019 and increased to 20% of total pipeline imports in December 2020. Russia had an average of 8.5% of the pipeline market share in 2020. Turkmenistan remains by far the largest exporter of pipeline gas to China, exporting 20.7 Mt, 60% of the total market in 2020, compared to 24.1 Mt, 66% of the total market in 2019.
Japan remains top LNG importer
Although China is expected to overtake Japan as the world’s largest LNG importer, Japan remained the world’s largest LNG importer in 2020, even though the country recorded a fall in LNG import volumes in 2020 compared to 2019. Japan imported 74.5 Mt in 2020, 3.7% lower than 2019 when it imported 77.3 Mt.
Korea saw a 1.4% fall in import volumes to 40.2 Mt in 2020 compared to 40.7 Mt in 2019. Korean LNG imports are expected to grow as coal and nuclear are replaced by gas and renewables.
Taiwan saw an increase in import volumes to 18.4 Mt in 2020, up 9.6% from 16.7 Mt in 2019.
China’s average import prices had the greatest fall, falling 26.7% to US$6.73/MMBtu compared to US$9.18/MMBtu in 2019. Pipeline prices also fell in 2020 to US$5.63/MMBtu, down 19.0% from US$6.95/MMBtu in 2019. Average import prices for Japan fell 21.8% to US$7.80/MMBtu in 2020 compared to US$9.97/MMBtu in 2019. Average import prices for Korea were US$7.57/MMBtu, a fall of 22.4% from US$9.75/MMBtu in 2019. Average import prices for Taiwan were US$6.37/MMBtu in 2020, down 26.5% from the average price of US$8.67/MMBtu in 2019. Australia’s prices averaged US$6.87/MMBtu in China, US$8.02/MMBtu in Japan, US$7.31/MMBtu in Korea and US$6.65/MMBtu in Taiwan.
China and Japan equal top Australian destinations
Australia had by far the largest market share in China in 2020 with 29.1 Mt (43.3%) of the total LNG imports. Qatar was the next largest exporting country with 8.1 Mt (12.1%) of the total Chinese LNG imports. However, both countries lost market share in 2020 compared to 2019, to Russia and the US. In 2019, Australia exported 27.9 Mt to China (46.1% of total imports) while Qatar exported 8.3 Mt (13.7% of total imports). Russia was an important exporter to China in 2020 with 5.1 Mt, twice the volume of their 2019 exports (2.5 Mt). Russia’s market share jumped from 4.2% in 2019 to 7.6% in 2020. The US was the standout improver in 2020, with the largest increase in LNG export volumes into China. The US increased their export volumes by almost 3.0 Mt from 0.3 Mt in 2019 to 3.3 Mt in 2020. This is a 12-fold increase, albeit from a low starting point, as a result of the easing of trade tensions between the two countries. Malaysia saw a 12.9% fall in exports to China to 6.1 Mt in 2020 compared to 6.9 Mt in 2019, while Indonesia increased exports to China by 11.3% to 5.1 Mt.
Australia also had the largest share of the Japanese market, with 29.1 Mt (39.1%) of the total LNG imports. Although total exports to Japan from Australia fell in 2020 compared to 30.1 Mt in 2019, market share increased marginally to 39.1% from 38.9% in 2019 due to Japan’s falling import volumes. Malaysia was the next most important exporter to Japan in 2020 with 14.2% market share, up from 12.1% in 2019. Malaysia exported a total of 10.6 Mt to Japan in 2020 compared to 9.3 Mt in 2019. Qatar exported 8.7 Mt (11.7% of total imports) to Japan in 2020 compared to 8.7 Mt (11.3%) in 2019.
In Korea, Qatar was the largest supplier with 9.1 Mt, 22.7% of total import volumes. This was lower compared to 2019 when Qatar supplied 11.3 Mt (27.8% of total imports). Australia was the next most important supplier with 8.0 Mt in 2020 compared to 7.8 Mt in 2019. Australia held 20% of the market share in Korea in 2020 compared to 19.1% in 2019. Malaysia and the US were also significant exporters to Korea, with 4.9 Mt (12.3%) and 5.8 Mt (14.5%) respectively in 2020. Both countries have increased their market share in Korea in 2020 compared to 2019.
Qatar was the largest supplier to Taiwan in 2020, with Australia in second place. Imports from Qatar were 5.2 Mt in 2020, up 11.4% from 4.7 Mt in 2019. Imports from Australia increased by 8% to 4.8 Mt in 2020. Russia was also an important supplier to Taiwan in 2020, exporting 2.5 Mt to Taiwan, while Malaysia’s exports fell significantly to 0.8 Mt after exporting 2.5 Mt to Taiwan in 2019.
Qatar’s market share in Taiwan increased slightly to 28.5% in 2020, up from 28.1% in 2019, while Australia’s market share decreased slightly from 26.7% in 2019 to 26.3% in 2020. Malaysia’s market share fell significantly in 2020, dropping to 4.6% of total imports from 14.8% in 2019. This market share was picked up by Russia, increasing market share to 13.5% from 8.8% in 2019, and Indonesia, increasing market share to 5.6% from 2.5% in 2019. The US also saw an increase in market share in Taiwan increasing to 6.2% from only 3.0% in 2019.
EnergyQuest estimates Australia delivered a total of 78.7 Mt LNG in 2020, up 2.2% from 77.0 Mt delivered in 2019. In a year marked by unusual events, Australia delivered one cargo to Chile and one cargo to Mexico, markets generally not seen as destinations for Australian cargoes. Other significant markets for Australian LNG in addition to China, Japan and Korea were Taiwan, where 4.8 Mt was delivered in 2020, up 7% from 4.5 Mt in 2019, and Malaysia, which imported 2.0 Mt of Australian LNG compared to 1.7 Mt in 2019, an increase of 20% year-on-year. Australia also exported 2.3 Mt to Singapore, up 18% from 1.9 Mt delivered in 2019, and 0.96 Mt to India in 2020, up marginally from the 0.92 Mt delivered in 2019.
Australian 2020 LNG export revenue down 25% to $36.2 billion
According to the Australian Bureau of Statistics (ABS) the total value of 2020 Australian LNG exports was $36.2 billion, down 25.5% from the 2019 record of $48.6 billion.
More than offsetting the fall in 2020 LNG export revenue, the value of petroleum imports (crude oil petrol, diesel, jet fuel etc.) fell from A$38.3 billion in 2019 to A$22.7 billion in 2020, reflecting lower prices and also lower demand due to travel restrictions, particularly in aviation.
Monthly revenue from LNG exports reached a 2020 low of A$1.8 billion in September, reflecting the lagged effect of lower oil prices. However, revenue has increased in every month since, reaching A$2.7 billion in December, up by 4.7% from A$2.5 billion in November.
We have been asked what impact lower LNG prices would have had on taxes to federal and state governments. West coast projects pay federal Petroleum Resource Rent Tax (PRRT). The only projects currently paying PRRT would be the NWS, Pluto and Darwin. The three new projects, Gorgon, Wheatstone and Ichthys, which cost at least US$118 billion, would probably all still be in the cost recovery phase for PRRT purposes. When costs are covered though they will pay PRRT of 40% of profit. However lower prices mean it will take longer to recover the US$118 billion.
The three Queensland projects pay state royalties rather than PRRT. Total Queensland petroleum royalties in 2019-20 were $466 million. The Queensland Treasury expects a 34% decline in 2020-21 but the government has increased royalty rates, which with improving prices is expected to increase royalties to $635 million in 2022-23 and $702 million in 2023-24.
January highlights
• Australian LNG shipments in January 2021 were higher compared with December 2020, primarily due to increased production at the Pluto project and the restart of production at the Prelude project. Australian projects shipped 6.7 million tonnes (Mt) (97 cargoes) in January, compared with 6.5 Mt (96 cargoes) in December. The monthly record for shipments was 7.1 Mt in December 2019.
• Australia’s January shipments were 78.5 Mtpa on an annualised basis.
• East coast projects shipped 2.068 Mt (31 cargoes) in January, just below the record set in December of 2.186 Mt. The east coast projects operated at 96% of nameplate capacity during January.
• Cargo delays subsided considerably during January. EnergyQuest estimates only two Australian cargoes have been delayed for more than three days awaiting final destination orders during January, after 9 December cargoes were delayed and 16 in November.
• Deliveries to major North Asian markets were significantly lower in January 2021 compared with December 2020. This reflects the fall in shipments in December due to disruptions at Gorgon, Wheatstone and Ichthys. Australian projects delivered a total of 94 cargoes to China, Japan, Korea and Taiwan in January, well down from 100 cargoes a month earlier. There were eight fewer deliveries to China, four less to Taiwan, four more to Korea two more to Japan compared with December 2020.
• As of 29 January, the Platts JKM LNG spot price for March was US$8.76/MMBtu on the back of a freer shipping market, and warmer temperatures in Asia.
• The Gladstone LNG producers had a production deficit in January, with total production from LNG producers 2.8 PJ less than total LNG exports. This is lower compared with December when the producers had a 6.6 PJ deficit. LNG producers had a surplus of 7.5 PJ in January 2020.
• Gas production from Moomba and offshore Victoria was down by 1.8 PJ including from storage compared with December but higher compared to a year ago.
• East coast electricity generation was down by 5% in January compared with a year earlier due to a cooler summer and COVID-19. With increased generation from Solar PV, operational (i.e. commercial) generation was down by 7.1%.
• Reflecting lower demand and higher renewable generation, generation from coal was down by 10% and from gas by 38% on a year earlier. East coast gas-use for generation was down, by 4.76 PJ (-41%) on a year earlier and 0.60 PJ lower compared with December, being replaced by solar and wind generation.
Monthly statistical summary
• In January Australian projects shipped 6.7 million tonnes (Mt) (97 cargoes), higher than 6.5 Mt (96 cargoes) in December but lower than the record 7.1 Mt (104 cargoes) in December 2019.
• Australian projects delivered 36 cargoes to China in January, after delivering 38 in December and 40 in January 2021.
• Forty-three deliveries were made to Japan in January, more than the 41 delivered in December but down on 45 delivered in January 2020.
• Australia delivered 10 cargoes to Korea in January, well down on the deliveries of last year when 16 cargoes were delivered.
• Australia’s January shipments were 78.5 Mtpa on an annualised basis.
• Average LNG plant capacity utilisation was 89.4% in January up from 87.7% in December.
• JKM Asian spot LNG price futures increased during the first half of January from US$15.10/MMBtu on 31 December (for February deliveries) to a record high of US$32.50/MMBtu on 13 January (for February deliveries) before decreasing to US$8.48/MMBtu on 28 January (for March deliveries). As of 9 February, the Platts JKM for March was well down at US$7.24/MMBtu.
• West Coast shipments increased to 4.6 Mt in January (4.4 Mt in December), with 66 cargoes in January compared to 63 in December. A year ago, the west coast shipped 75 cargoes of 5.1 Mt.
• East Coast LNG shipments decreased to 2.1 Mt in January (2.2 Mt in December), with 31 cargoes compared to 33 in December, and 29 cargoes of 1.9 Mt a year ago.
• There were two January spot cargoes reported from the east coast, both Petronas cargoes from GLNG, and six spot cargoes from the west coast (8% of total shipments).
• Gladstone Ports Corporation data shows the east coast projects shipped 1.3 Mt to China in January (1.4 Mt in December), 0.29 Mt to Korea (0.28 Mt), 0.19 Mt to Japan (0.32 Mt, and 0.06 Mt each to Malaysia (0.19 Mt) and Singapore. In January 2020 Gladstone shipped 1.4 Mt to China, 0.29 Mt to Korea, 0.13 Mt to Japan and 0.19 Mt to Malaysia.
• Queensland imported gas from the other states in January, with flows in an easterly direction seen throughout the month. Net gas flows to Queensland from other states were 5.0 PJ in January.
• CSG production from fields operated by the LNG producers was 121.1 PJ in January, down from 124.4 PJ in December and 2.8 PJ below exports including fuel gas.
• Queensland short-term domestic gas prices in January were lower compared to those in December averaging $6.52/GJ ($7.05/GJ in December) at Wallumbilla and $6.54/GJ ($6.97/GJ) in Brisbane.
• Southern short-term domestic gas prices in January were lower than those in December averaging $6.06/GJ ($6.37/GJ) in Sydney and $5.44/GJ ($5.95/GJ) in Victoria, but higher averaging $6.49/GJ ($6.33/GJ) in Adelaide.
• East coast gas-use for power generation was down by 41% (4.8 PJ) in January compared with a year earlier and 0.60 PJ lower than in December.
-----
Earlier:
2021, February, 16, 12:05:00
LNG DEMAND UP
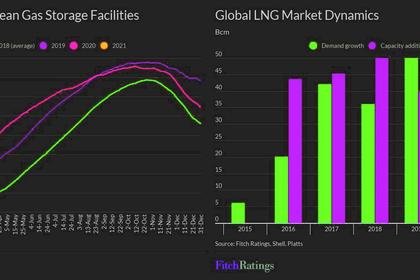
Growing liquified natural gas (LNG) demand will reduce market oversupply in 1H21, with volumes of gas in European storage facilities already normalised due to the cold winter in the northern hemisphere,
2021, February, 10, 11:35:00
LNG DEFICIT
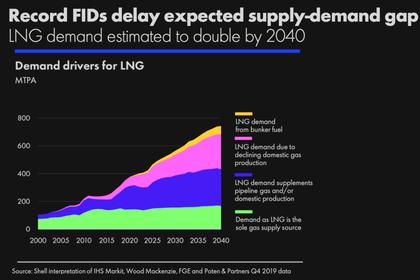
Novatek expects worldwide LNG demand to continue to grow even as countries decarbonise their energy systems.
2021, February, 9, 15:40:00
LNG PRODUCTION DOWN
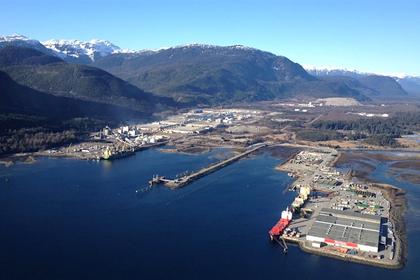
LNG Canada initially is to consist of two trains that together would provide 14 million metric tons/year of gas.
2021, February, 3, 12:50:00
RUSSIA'S LNG POTENTIAL 140 MLN TONS
Developing the potential LNG projects will allow Russia to almost triple LNG production by 2035 and produce additional 2.5 trillion cbm of gas by 2040.
2021, February, 2, 12:05:00
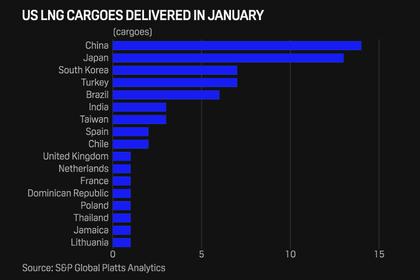
U.S. LNG GROWTH FOR CHINA
December was the first time China had been the top monthly US destination since deliveries resumed in April 2020 following a 13-month pause due to tariffs.
2021, January, 15, 11:50:00
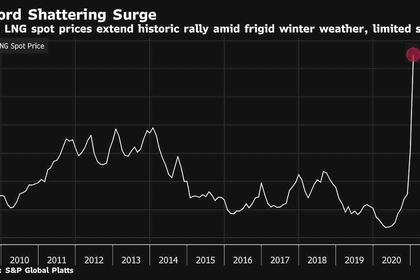
LNG PRICES UP ANEW
Spot LNG prices LNG-AS have nearly tripled since early November as freezing temperatures across North Asia boosted demand and depleted inventories. Since July, prices are up a dizzying 1,000%.
2021, January, 14, 14:15:00
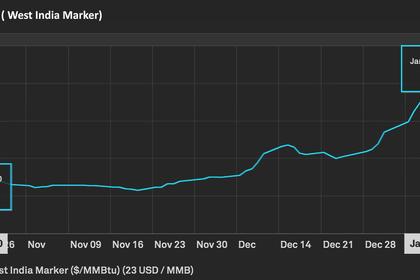
LNG PRICES UP
The combination of a severe cold snap in Asia, supply outages and maritime congestion has propelled spot prices for LNG to previously unforeseen heights. The North Asian price benchmark has now risen 18-fold in less than nine months, outperforming other commodities


