2021-02-15 13:20:00


THE NEW U.S. RENEWABLES 22.5 GW
By Ken Bossong Executive Director SUN DAY Campaign
ENERGYCENTRAL- Feb 9, 2021 - According to a review by the SUN DAY Campaign of data just released by the Federal Energy Regulatory Commission (FERC), renewable energy sources (i.e., biomass, geothermal, hydropower, solar, wind) strongly dominated new U.S. electrical generating capacity additions in 2020.
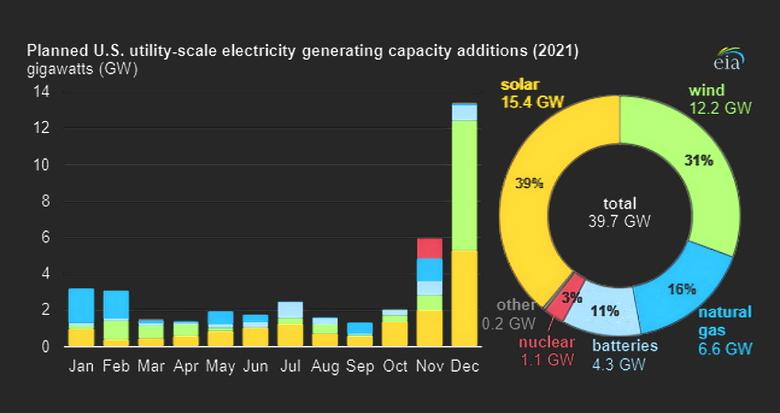
Combined, they accounted for or 22,451 megawatts (MW) or more than three-quarters (78.09%) of the 28,751 MW of new utility-scale capacity reported to have been added last year. Wind (13,626 MW) and solar (8,543 MW) each contributed more new generating capacity than did natural gas (6,259 MW). [1]
FERC's latest monthly "Energy Infrastructure Update" report (with data through December 31, 2020) also reveals that natural gas accounted for 21.77% of the total, with very small contributions by coal (30 MW), oil (6 MW), and "other" sources (5 MW) providing the balance. There were no new capacity additions by nuclear power or geothermal energy during the year.
Wind farms added 5,004 MW in December alone and provided nearly half (47.39%) of the new capacity for the year. Solar accounted for 29.71% of new generating capacity. Combined with a small amount of hydropower, wind and solar were the only new sources of new generating capacity during six (June through November) of the twelve months of 2020
Renewable energy sources now account for 24.06% of the nation’s total available installed generating capacity and continue to expand their lead over coal (19.65%) and nuclear power (8.57%). The generating capacity of just wind (9.83%) is nearly a tenth of the nation's total while wind and solar combined account for 14.15% … and that does not include distributed (e.g., rooftop) solar. [2]
For perspective, ten years ago, FERC reported that installed renewable energy generating capacity was 13.71% of the nation's total. Five years later, it had increased to 17.83%. With current capacity now at 24.06%, renewables now appear to be on track to reach - and likely exceed - 30% of the nation's total generating capacity by 2025.
In fact, FERC data suggest that renewables’ share of generating capacity is on track to increase significantly over the next three years (i.e., by December 2023). “High probability” generation capacity additions for wind, minus anticipated retirements, reflect a projected net increase of 21,938 MW while solar is foreseen growing by substantially more - 36,691 MW. By comparison, net growth for natural gas will be only 17,279 MW. Thus, wind and solar combined are forecast to provide more than three times (3.39%) as much new generating capacity as natural gas over the next three years. Hydropower is also projected to experience growth (898 MW), while biomass and geothermal may dip by 217 MW and 2 MW respectively.
On the other hand, the generating capacities of coal and oil are projected to plummet - by 24,024 MW and 4,369 MW respectively. In fact, FERC reports no new coal capacity in the pipeline over the next three years and just 5 MW of new oil-based capacity. Nuclear power is likewise forecast to drop sharply - by 4,330 MW, or more than 4% of its currently operating capacity.
In total, the mix of all renewables will add more than 59,308 MW of net new generating capacity to the nation’s total by December 2023 while the net new capacity from natural gas, coal, oil, and nuclear power combined will actually drop by more than 15,400 MW .
If FERC's projections prove accurate, over the next three years, renewable energy generating capacity should account for comfortably more than a quarter of the nation's total available installed generating capacity - increasing to 27.92%. Meanwhile, coal's share will drop to 17.07%, nuclear's to 7.93%, and oil's to 2.76%. Natural gas' share will also decline slightly to 44.15%, compared to 44.33% now.
In fact, renewables’ share could - and probably will - be even higher. Over the past 23 months, FERC has been regularly increasing its renewable energy projections in the monthly “Infrastructure” reports. FERC's first such projection - provided in its March 2019 report - forecast the addition of 36,608 MW of wind and solar during the ensuing three years. In its most recent report, those forecasts had grown to 58,629 MW of new solar and wind capacity by December 2023.
Moreover, FERC's data also outline a second - albeit less probable - scenario for even higher net additions by solar (151,199 MW) and wind (80,256 MW), which would be more than five times those projected for natural gas (43,474 MW).
"Renewable energy sources - especially wind and solar - dominated new capacity additions for yet another year, continuing the nearly unbroken pattern of the past half-decade," noted Ken Bossong, Executive Director of the SUN DAY Campaign. "Now, with a very supportive Biden Administration and Democratic majorities in the U.S. Senate and House of Representatives, renewables are clearly on course to become the foundation of the nation's electricity supply."
# # # # # # # # #
[1] Capacity is not the same as actual generation. Capacity factors for nuclear power and fossil fuels tend to be higher than those for most renewables. For example, for calendar year 2019, the U.S. Energy Information Administration (EIA) reported that renewables accounted for 18.2% of the nation's total electrical generation - that is, somewhat less than was their share of installed generating capacity (22.1%) for the same period. Conversely, coal's share of generating capacity in 2019 was 20.9% while its share of electrical generation was 23.3%.
[2] FERC generally only reports data for utility-scale facilities (i.e., those rated 1-MW or greater) and therefore its data do not reflect the capacity of distributed renewables, notably rooftop solar PV which - according to the EIA - accounts for nearly a third of the nation's electrical generation by solar. That would suggest that the total of distributed and utility-scale solar capacity combined may be as much as 50% higher than the solar capacity of 4.3% reported by FERC -- i.e., closer to 6%.
Sources:
FERC's 7-page "Energy Infrastructure Update for December 2020" was released on February 8, 2021. It can be found at https://www.ferc.gov; open the link "Industries and Data," then follow to "FERC Staff Reports and Papers," and then to "Energy Infrastructure." For the information cited in this update, see the tables entitled "New Generation In-Service (New Build and Expansion)," "Total Available Installed Generating Capacity," and "Generation Capacity Additions and Retirements."
The U.S. Energy Information Administration issued its "Electric Power Monthly" report for calendar year 2019 on February 26, 2020. It may be found at: https://www.eia.gov/electricity/monthly
Follow the link to "previous issues" and then to "December 2019". The data cited in this update can be found at, or extrapolated from, Tables ES1.A and ES1.B.
# # # # # # # # #
The SUN DAY Campaign is a non-profit research and educational organization founded in 1992 to support a rapid transition to 100% reliance on sustainable energy technologies as a cost-effective alternative to nuclear power and fossil fuels and as a solution to climate change.
-----
This thought leadership article was originally shared with Energy Central's Clean Power Community Group. The communities are a place where professionals in the power industry can share, learn and connect in a collaborative environment. Join the Clean Power Community today and learn from others who work in the industry.
-----
Earlier:
2021, January, 26, 12:10:00
U.S. ENERGY TRANSITION STRATEGY
Some of the country's largest energy customers, including Amazon, Facebook, General Motors, McDonald's, PepsiCo, Target and Walmart have called on the federal government to implement "strong and specific national policies" to accelerate the transition to a zero-carbon dioxide emissions power sector

2021, January, 21, 14:10:00
U.S. NUCLEAR DEVELOPMENT
The U.S. nuclear energy industry pulled out some big wins in 2020,
2021, January, 19, 13:45:00
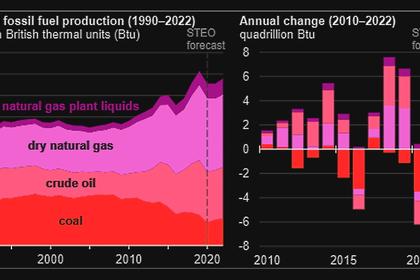
U.S. FOSSIL FUEL WILL UP
U.S. production of all fossil fuels—crude oil, coal, dry natural gas, and natural gas plant liquids (NGPL)—to increase in 2022, but forecast fossil fuel production will remain lower than the 2019 peak.

2021, January, 14, 13:50:00
U.S. CLEAN ENERGY JOBS DOWN
The US clean energy industry has haemorrhaged over 400,000 jobs since the outbreak of the Covid-19 pandemic,
2020, December, 22, 13:20:00
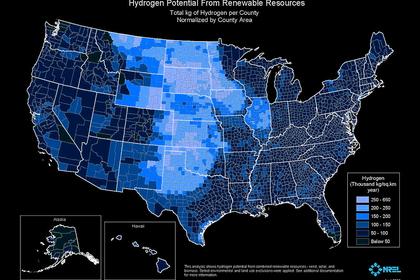
U.S. HYDROGEN ENERGY
Renewable gases and zero-carbon hydrogen will play a key role in decarbonizing the US natural gas distribution system and the industry's environmental stewardship,
2020, December, 7, 12:55:00
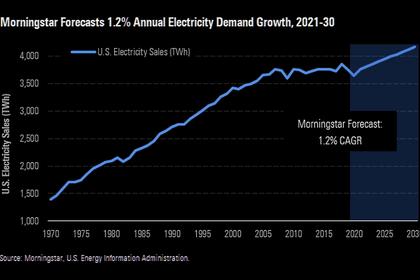
U.S. ELECTRICITY DEMAND CHANGES
In April and May, at the peak of the COVID-19 restrictions, electricity demand fell 5.8%, the largest two-month drop in 50 years of recordkeeping.


