2021-02-01 12:20:00


U.S. GAS PRODUCTION DOWN
U.S. EIA - January 29, 2021 - Natural Gas Monthly
November 2020
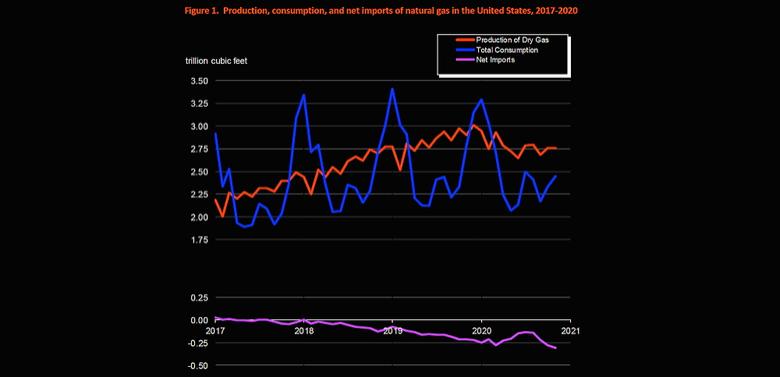
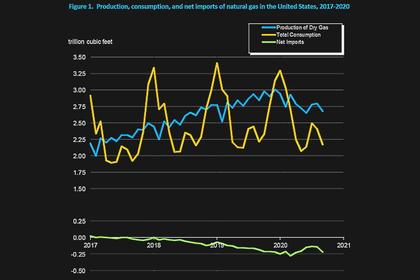
- In November 2020, for the seventh consecutive month, dry natural gas production decreased year over year for the month. The preliminary level for dry natural gas production in November 2020 was 2,757 billion cubic feet (Bcf), or 91.9 Bcf/d. This level was 4.8 Bcf/d (-5.0%) lower than the November 2019 level of 96.7 Bcf/d. Despite this year-over-year decrease, the average daily rate of dry production was the second highest for the month since the U.S. Energy Information Administration (EIA) began tracking monthly dry production in 1973. Gross withdrawals and marketed production of natural gas in November 2020 were as follows:
- Gross withdrawals: 3,368 Bcf for the month, or 112.3 Bcf/d
- Down 3.7% compared with 116.5 Bcf/d in November 2019.
- Marketed production: 2,988 Bcf for the month, or 99.6 Bcf/d
- Down 4.2% compared with 104.0 Bcf/d in November 2019. Although production was down year over year nationwide, Pennsylvania (20.6 Bcf/d) and West Virginia (7.5 Bcf/d) saw their highest daily rates of marketed production for any month in November 2020 since EIA began tracking monthly marketed production in 1991.
- Estimated natural gas consumption in November 2020 was 2,446 Bcf, or 81.5 Bcf/d. This level was 11.1 Bcf/d (12.0%) lower than the 92.6 Bcf/d consumed in November 2019.
- The year-over-year average daily rate of consumption of dry natural gas in November 2020 decreased in each of the four consuming sectors. Deliveries of natural gas by consuming sector in November 2020 were as follows:
- Residential deliveries: 442 Bcf for the month, or 14.7 Bcf/d
- Down 25.0% compared with 19.6 Bcf/d in November 2019. Residential deliveries were the lowest for the month since 2016.
- Commercial deliveries: 295 Bcf for the month, or 9.8 Bcf/d
- Down 24.2% compared with 13.0 Bcf/d in November 2019. Commercial deliveries were the lowest for the month since 2016.
- Industrial deliveries: 712 Bcf for the month, or 23.7 Bcf/d
- Down 3.1% compared with 24.5 Bcf/d in November 2019.
- Electric power deliveries: 767 Bcf for the month, or 25.6 Bcf/d
- Down 6.3% compared with 27.3 Bcf/d in November 2019. Despite this decrease, electric power deliveries were the second highest for the month since EIA began using the current definitions for consuming sectors in 2001.
- Net natural gas imports (imports minus exports) were -311 Bcf, or -10.4 Bcf/d, in November 2020, making the United States a net exporter. Natural gas imports and exports in November 2020 were as follows:
- Total imports: 216 Bcf for the month, or 7.2 Bcf/d
- Down 3.6% compared with 7.5 Bcf/d in November 2019. The average daily rate of natural gas imports was the second lowest for the month since 1993.
- Total exports: 527 Bcf for the month, or 17.6 Bcf/d
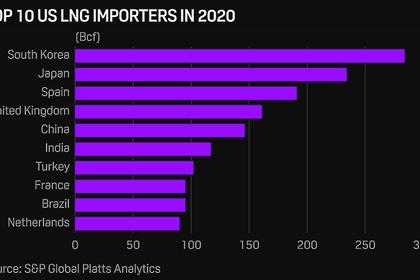
- Up 19.5% compared with 14.7 Bcf/d in November 2019. The average daily rate of natural gas exports was the highest for any month since EIA began tracking monthly exports in 1973. Liquefied natural gas (LNG) exports in November 2020 were also the highest for any month on record, up 47.1% compared with November 2019. In November 2020, the United States exported 9.4 Bcf/d of LNG to 26 countries.
-----
Earlier:
2021, January, 22, 11:20:00
U.S. GAS PRICES WILL UP
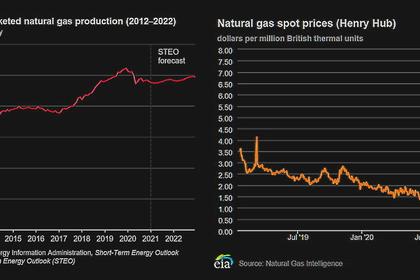
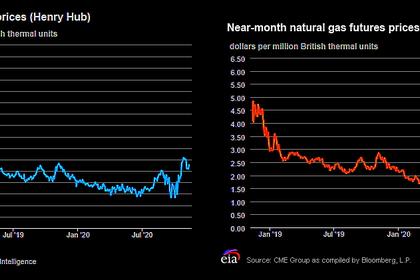
The annual natural gas spot price at the Henry Hub will rise 98¢ per million British thermal units (MMBtu) to average $3.01/MMBtu in 2021.
2021, January, 19, 13:45:00
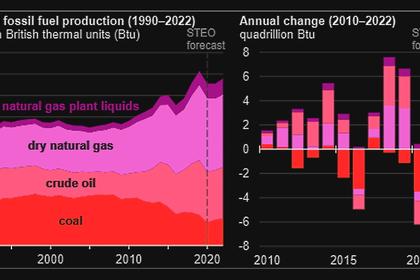
U.S. FOSSIL FUEL WILL UP
U.S. production of all fossil fuels—crude oil, coal, dry natural gas, and natural gas plant liquids (NGPL)—to increase in 2022, but forecast fossil fuel production will remain lower than the 2019 peak.
2021, January, 15, 11:40:00
U.S. GAS PRODUCTION UPDOWN
U.S. marketed gas production for 2021 will fall 2% and average 96.2 billion cubic feet per day (Bcf/d).
2021, January, 12, 11:25:00
U.S. LNG FOR ASIA UP
The current trend suggests that Asia will remain the top destination for US LNG for months to come, following robust deliveries to the continent in 2020.
2020, December, 1, 13:20:00
U.S. GAS PRODUCTION DOWN ANEW
The preliminary level for dry natural gas production in September 2020 was 2,678 billion cubic feet (Bcf), or 89.3 Bcf/d. This level was 5.4 Bcf/d (-5.7%) lower than the September 2019 level of 94.7 Bcf/d.
2020, November, 17, 13:00:00
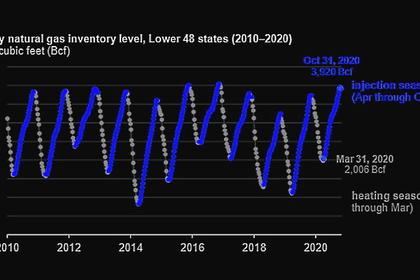
U.S. GAS INVENTORIES UP
The amount of working natural gas in storage in the United States ended the natural gas injection, or refill, season (April 1–October 31) at 3,920 billion cubic feet (Bcf),
2020, November, 13, 13:15:00
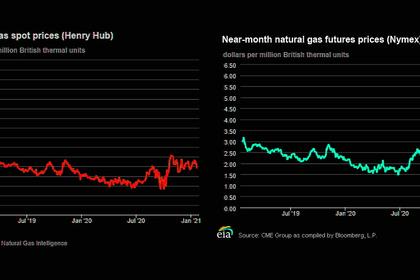
U.S. GAS PRICES UP TO $3
the natural gas spot price at the Henry Hub reached $3.00 per million British thermal units (MMBtu), its highest value since March 2019,


