2021-02-24 10:25:00


U.S. INDUSTRIAL PRODUCTION UP 0.9%
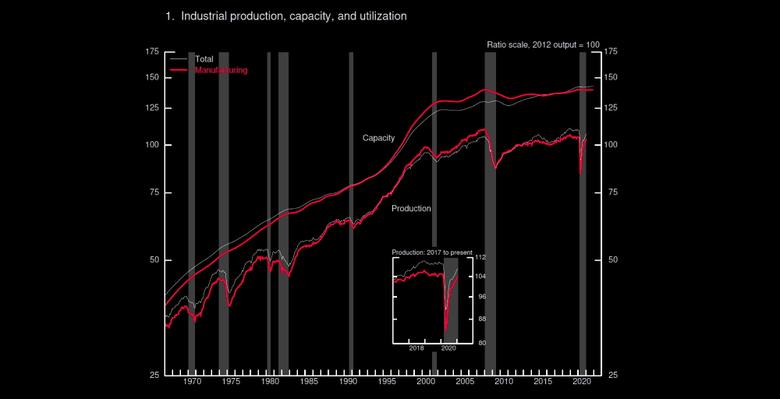
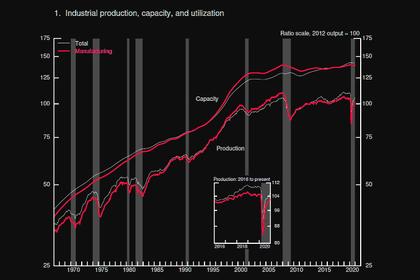
U.S. FRB - February 17, 2021 - Industrial production increased 0.9 percent in January. Manufacturing output rose 1.0 percent, about the same as its average gain over the previous five months. Mining production advanced 2.3 percent, while the output of utilities declined 1.2 percent. At 107.2 percent of its 2012 average, total industrial production in January was 1.8 percent lower than its year-earlier level. Capacity utilization for the industrial sector increased 0.7 percentage point in January to 75.6 percent, a rate that is 4.0 percent below its long-run (1972–2020) average.


Market Groups
Most market groups posted gains in January, with the only noteworthy declines coming for consumer paper products, paper materials, transit equipment, information processing equipment, and consumer energy products. Materials recorded large gains, with increases of about 1-1/4 percent for each of its major components.
Total industrial production has not returned to its pre-pandemic levels of early last year. In January, the indexes for about half of the market groups were still below their year-earlier readings; notably, weakness in the oil patch during most of last year has left the production of energy materials 6.2 percent below its level of 12 months earlier. Strong gains during the second half of last year, however, have boosted the indexes for all of the major categories of consumer goods and for defense and space equipment above their year-earlier levels.
Industry Groups
Manufacturing output increased 1.0 percent in January. Durable and nondurable manufacturing recorded advances of 0.9 percent and 1.2 percent, respectively, while other manufacturing (publishing and logging) posted a decrease of 0.8 percent. Among durables, many sectors experienced gains of between 1 and 2-1/2 percent. The largest gain, 3.9 percent, was posted by primary metals, while the only losses were posted by nonmetallic mineral products and by motor vehicles and parts. The output of motor vehicles was held down by a global shortage of semiconductors used in vehicle components. Most nondurable sectors recorded growth rates in the 1 to 2 percent range. The only exceptions were the indexes for paper and for printing and support, which both declined a bit more than 1/2 percent.
The output of utilities fell 1.2 percent in January, largely because of a drop of 5.7 percent for natural gas utilities. The index for mining jumped 2.3 percent. Oil and gas well drilling continued its climb with an advance of 11.3 percent, though it remains about 50 percent below its year-earlier level. An increase of more than 1 percent for oil and natural gas extraction also contributed significantly to the gain for mining in January.
Capacity utilization for manufacturing increased 0.7 percentage point in January to a rate 14.5 percentage points higher than its trough in April and less than 1 percentage point below its pre-pandemic level. The operating rate for mining rose 2.0 percentage points to 82.2 percent, while the operating rate for utilities dropped 1.1 percentage points to 73.5 percent; both rates remained below their long-run averages.
Note: Preliminary Estimates of Industrial Capacity
The data in this release include preliminary estimates of industrial capacity for 2021 (table 8). Measured from fourth quarter to fourth quarter, total industrial capacity is projected to rise 0.5 percent this year after being unchanged in 2020. Manufacturing capacity is expected to edge up 0.2 percent in 2021 after slipping 0.2 percent in 2020. Capacity in the mining sector is estimated to drop 1.7 percent in 2021 after falling 2.1 percent in 2020. Capacity at electric and natural gas utilities is projected to increase 2.6 percent in 2021 after expanding 3.2 percent in 2020.
Revision of Industrial Production and Capacity Utilization
The Federal Reserve Board plans to issue its annual revision to the indexes of industrial production (IP) and the related measures of capacity utilization in the first half of 2021. New annual benchmark data for manufacturing for 2017 and 2018 will be incorporated, as well as other annual data, including information on the mining of metallic and nonmetallic minerals (except fuels). The weights for market-group splits of the industry-level indexes will be updated with information from the 2012 benchmark input-output accounts from the U.S. Bureau of Economic Analysis. The updated IP indexes will include revisions to the monthly indicator (either product data or input data) and to seasonal factors for each industry. In addition, the estimation methods for some series may be changed. Any modifications to the methods for estimating the output of an industry will affect the index from 1972 to the present.
Capacity and capacity utilization will be revised to incorporate data for manufacturing through the fourth quarter of 2019 from the U.S. Census Bureau's Quarterly Survey of Plant Capacity Utilization, along with new data on capacity from the U.S. Geological Survey, the U.S. Department of Energy, and other organizations.
Note. The statistics in this release cover output, capacity, and capacity utilization in the U.S. industrial sector, which is defined by the Federal Reserve to comprise manufacturing, mining, and electric and gas utilities. Mining is defined as all industries in sector 21 of the North American Industry Classification System (NAICS); electric and gas utilities are those in NAICS sectors 2211 and 2212. Manufacturing comprises NAICS manufacturing industries (sector 31-33) plus the logging industry and the newspaper, periodical, book, and directory publishing industries. Logging and publishing are classified elsewhere in NAICS (under agriculture and information respectively), but historically they were considered to be manufacturing and were included in the industrial sector under the Standard Industrial Classification (SIC) system. In December 2002 the Federal Reserve reclassified all its industrial output data from the SIC system to NAICS.
-----
Earlier:
2021, February, 8, 12:30:00
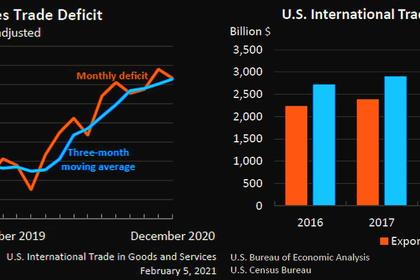
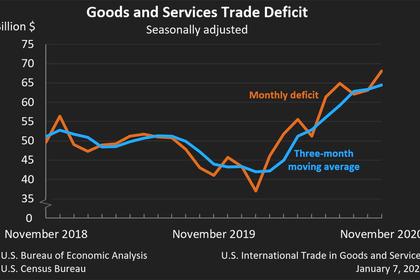
U.S. INTERNATIONAL TRADE DEFICIT DOWN TO $66.6 BLN
the U.S. goods and services deficit was $66.6 billion in December, down $2.4 billion from $69.0 billion in November
2021, January, 28, 12:35:00
U.S. FEDERAL FUNDS RATE 0.0 - 0.25% ANEW
The Committee decided to keep the target range for the federal funds rate at 0 to 1/4 percent
2021, January, 18, 12:55:00
U.S. INDUSTRIAL PRODUCTION UP 1.6%
U.S. industrial production advanced 1.6 percent in December, with gains of 0.9 percent for manufacturing, 1.6 percent for mining, and 6.2 percent for utilities.
2021, January, 12, 11:30:00
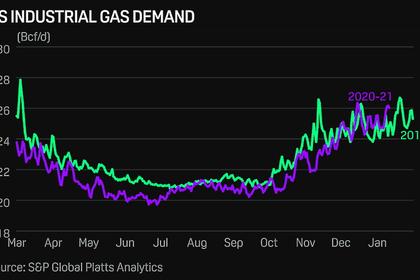
U.S. INDUSTRIAL GAS DEMAND UP
Over the past six weeks, the growth in US industrial gas demand has been fueled in large part by industries in the Northeast, Texas and the Southeast, which together account for over 60% of US industrial gas consumption.
2021, January, 11, 12:35:00
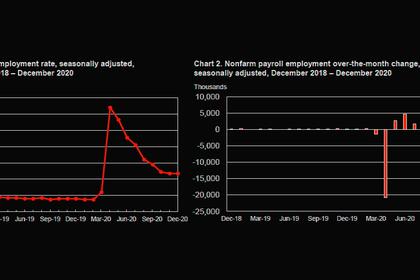
U.S. EMPLOYMENT DOWN BY 140,000
Total nonfarm payroll employment declined by 140,000 in December, and the unemployment rate was unchanged at 6.7 percent
2021, January, 8, 15:15:00
U.S. INTERNATIONAL TRADE DEFICIT UP TO $68 BLN
the U.S. goods and services deficit was $68.1 billion in November, up $5.0 billion from $63.1 billion in October
2020, December, 23, 12:50:00
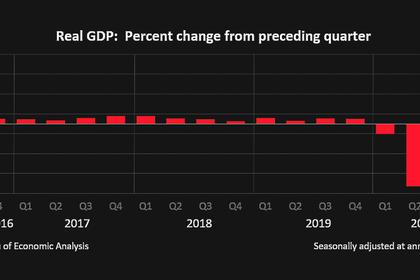
U.S. GDP UP 33.4%
U.S. real gross domestic product (GDP) increased at an annual rate of 33.4 percent in the third quarter of 2020


