2021-02-19 13:10:00


U.S. LNG EXPORTS WILL UP
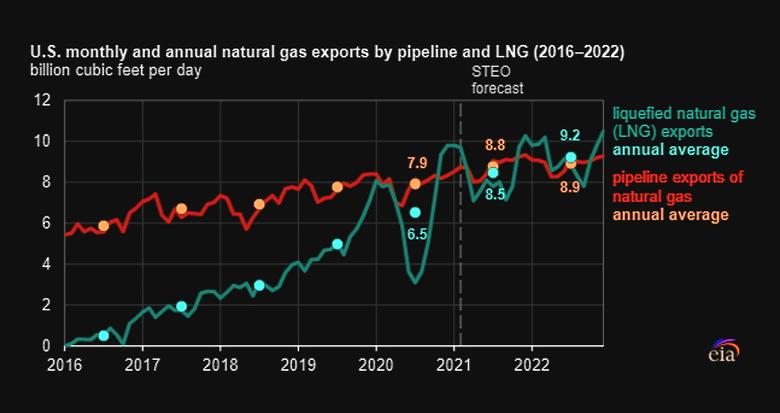
U.S. EIA - FEBRUARY 18, 2021 - According to the U.S. Energy Information Administration’s (EIA) February 2021 Short-Term Energy Outlook (STEO), EIA forecasts that U.S. liquefied natural gas (LNG) exports will exceed natural gas exports by pipeline in the first and fourth quarters of 2021 and on an annual basis in 2022. Monthly U.S. LNG exports exceeded natural gas exports by pipeline by nearly 1.2 billion cubic feet per day (Bcf/d) in November 2020, according to EIA’s Natural Gas Monthly. LNG exports have only exceeded natural gas exports by pipeline once since 1998—in April 2020—by 0.01 Bcf/d.
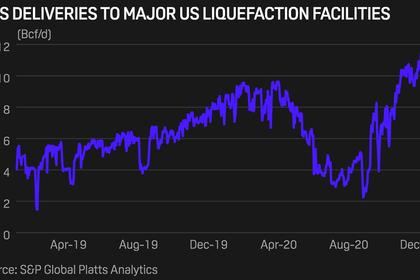
U.S. LNG exports set consecutive monthly records of 9.4 Bcf/d in November and of 9.8 Bcf/d in both December 2020 and January 2021, according to EIA’s estimates based on the shipping data provided by Bloomberg Finance, L.P. EIA forecasts that U.S. LNG gross exports will average 9.7 Bcf/d in February 2021 before declining to seasonal lows in the shoulder months of the spring and fall seasons. EIA forecasts LNG exports to average 8.5 Bcf/d in 2021 and 9.2 Bcf/d in 2022, compared with average gross pipeline exports of 8.8 Bcf/d in 2021 and 8.9 Bcf/d in 2022.
Since November 2020, all six U.S. LNG export facilities have been operating near full design capacity. In December, the Corpus Christi LNG facility in Texas commissioned its third and final liquefaction unit six months ahead of schedule, bringing the total U.S. liquefaction capacity to 9.5 Bcf/d baseload (10.8 Bcf/d peak) across six export terminals. The November–January increase in U.S. LNG exports has been driven by rising international natural gas and LNG prices, particularly in Asia, and lower global LNG supply because of unplanned outages at several LNG export facilities worldwide.

U.S. pipeline exports to Mexico increased by 6.4% in the first eleven months of 2020 compared with the same period in 2019 as a result of the completion of a new segment of the Wahalajara pipeline system in June and the Cempoala compressor station in September. The completion of Mexico’s Samalayuca-Sásabe pipeline (0.47 Bcf/d capacity) in January 2021 and the expected completion of Tula-Villa de Reyes pipeline (0.89 Bcf/d capacity) later this year are expected to further increase U.S. pipeline exports to Mexico.
-----
Earlier:
2021, February, 2, 12:05:00
U.S. LNG GROWTH FOR CHINA
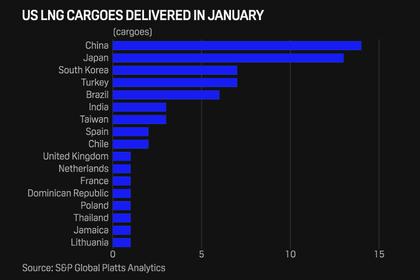
December was the first time China had been the top monthly US destination since deliveries resumed in April 2020 following a 13-month pause due to tariffs.
2021, February, 1, 12:20:00
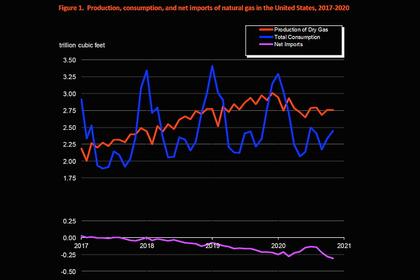
U.S. GAS PRODUCTION DOWN
The preliminary level for dry natural gas production in November 2020 was 2,757 billion cubic feet (Bcf), or 91.9 Bcf/d. This level was 4.8 Bcf/d (-5.0%) lower than the November 2019 level of 96.7 Bcf/d.
2021, February, 1, 12:10:00
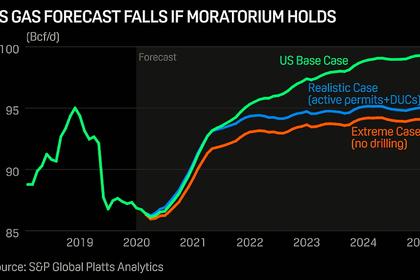
U.S. GAS MORATORIUM
Following the recent issuance of a 60-day moratorium on new drilling permits and land leases on federal land, President Joe Biden Jan. 27 signed an executive order that would suspend all new federal oil and gas leases,
2021, January, 22, 11:20:00
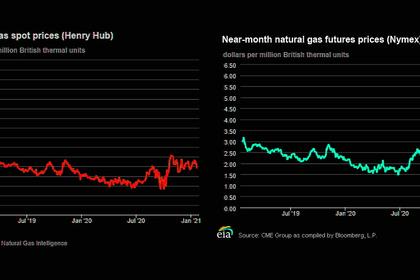
U.S. GAS PRICES WILL UP
The annual natural gas spot price at the Henry Hub will rise 98¢ per million British thermal units (MMBtu) to average $3.01/MMBtu in 2021.
2021, January, 19, 13:45:00
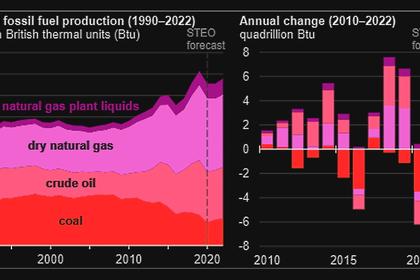
U.S. FOSSIL FUEL WILL UP
U.S. production of all fossil fuels—crude oil, coal, dry natural gas, and natural gas plant liquids (NGPL)—to increase in 2022, but forecast fossil fuel production will remain lower than the 2019 peak.
2021, January, 12, 11:25:00
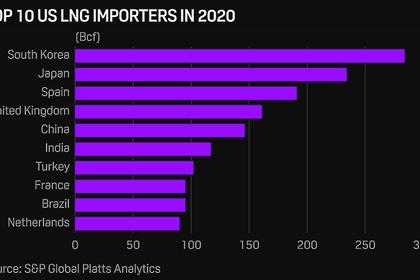
U.S. LNG FOR ASIA UP
The current trend suggests that Asia will remain the top destination for US LNG for months to come, following robust deliveries to the continent in 2020.
2020, December, 8, 12:50:00
U.S. LNG EXPORTS UP
LNG suppliers are continuing to respond to the uptick in demand and prices with the US now exporting at historically high volumes.


