2021-03-12 11:55:00


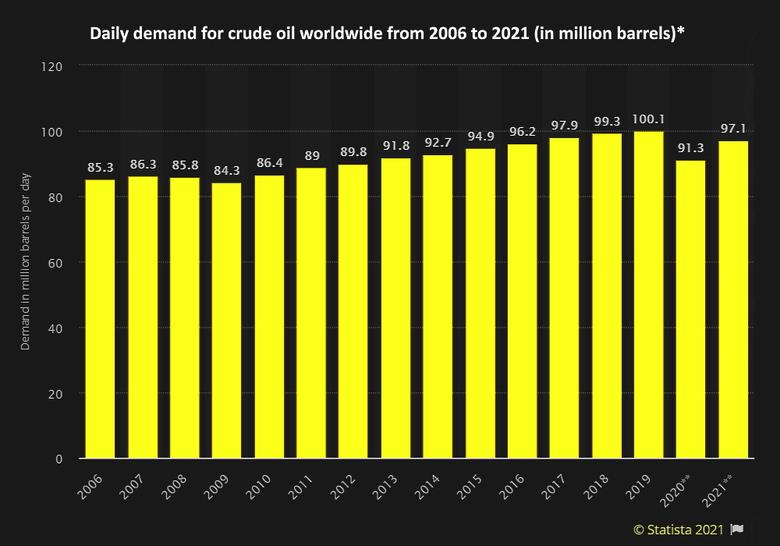
GLOBAL OIL DEMAND WILL UP BY 5.9 MBD
OPEC - 11 March 2021 - OPEC MONTHLY OIL MARKET REPORT
Oil Market Highlights
Crude Oil Price Movements
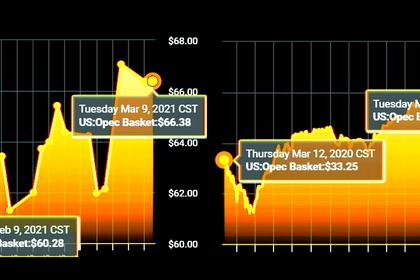
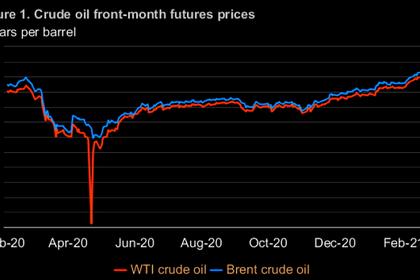
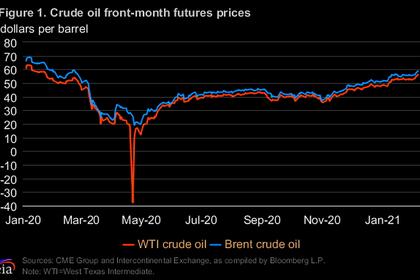
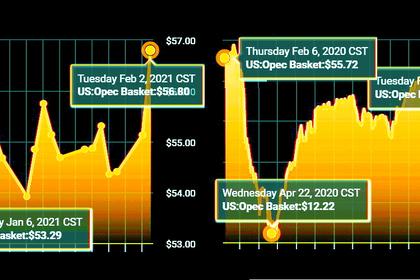
Spot crude prices surged by more than 13% in February to their highest monthly average since January 2020. Oil prices were supported by ongoing improvements in oil market fundamentals and a futures market that remained bullish in anticipation of a recovery in demand amid restrained global oil supplies. Oil prices extended gains after severe winter weather triggered a supply disruption in the US. The OPEC Reference Basket (ORB) gained $6.67, or 12.3%, to average $61.05/b for the month. Similarly, crude oil futures prices increased sharply in February on both sides of the Atlantic, with the ICE Brent front month up $6.96, or 12.6%, to average $62.28/b while NYMEX WTI rose $6.96, or 13.4%, to average $59.06/b. Consequently, the Brent-WTI spread was unchanged in February, averaging $3.22/b. The forward curve of the three main futures prices – Brent, WTI and Dubai – steepened further last month as the market rebalancing process continued. Meanwhile, hedge funds and other money managers were bullish on the outlook for oil prices, further increasing combined futures and options net long positions linked to ICE Brent and NYMEX WTI to their highest point in more than a year.
World Economy
The contraction in the global economy in 2020 is reduced after the better-than-expected actual performance by key economies in 2H20. As a result, the global economy now shows a decline of 3.7%, y-o-y. For 2021, additional stimulus measures in the US and an accelerating recovery in Asian economies are expected to raise the global economic growth forecast to 5.1%. However, this forecast remains surrounded by uncertainties including but not limited to COVID-19 variants, the effectiveness of vaccines, sovereign debt levels in many regions, inflationary pressures, and central bank responses. After a contraction of 3.5% in 2020, US economic growth in 2021 is now expected to reach 4.8%. The forecast for the Euro-zone in 2021 is raised to 4.3%, following a contraction of 6.8% last year. Japan’s GDP in 2020 is officially reported at a contraction of 4.9%, while it is forecast at 3.1% for 2021. Following growth of 2.3% in 2020, China’s GDP is forecast to increase by 8% in 2021. Official data shows India’s economy contracted by 7.0% last year but the country’s growth in 2021 is expected to reach 9%. Government estimates show Brazil’s economy contracted by 4.1% in 2020 but the growth forecast for 2021 is expected to be at 3%. After contracting by 3.1% in 2020, Russia’s growth forecast for 2021 is expected to remain at 3%.
World Oil Demand
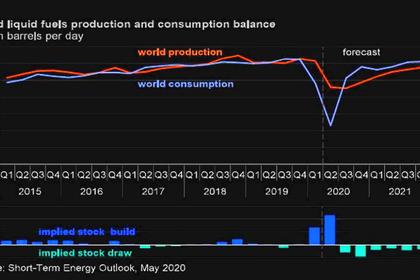
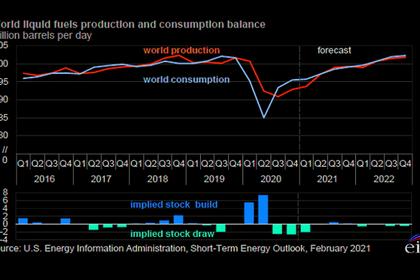
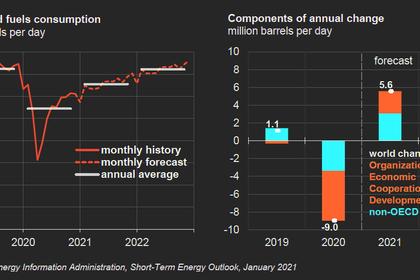
World oil demand in 2020 shows a contraction of 9.6 mb/d, to stand at 90.4 mb/d. OECD oil demand contracted by 5.6 mb/d, while non-OECD demand declined by 4 mb/d. For 2021, world oil demand is expected at 5.9 mb/d, to stand at 96.3 mb/d. Oil requirements in 1H21 are adjusted lower, mainly due to extended measures to control COVID-19 in many key parts of Europe. In addition, elevated unemployment rates in the US slowed the recovery process. In contrast, oil demand in 2H21 is adjusted higher, reflecting expectations for a stronger economic recovery with the positive impact of vaccination rollouts. In regional terms, OECD oil demand is expected to increase by 2.6 mb/d in 2021 to stand at 44.6 mb/d, while non-OECD demand is seen rising by 3.3 mb/d to average 51.6 mb/d.
World Oil Supply
Non-OPEC liquids production is estimated to average 62.9 mb/d in 2020, a contraction of 2.6 mb/d, y-o-y. Non-OPEC oil supply in 2020 declined in Canada, Colombia, Kazakhstan, Malaysia, the UK and Azerbaijan, but increased in Norway, Brazil, China, and Guyana. Non-OPEC liquids supply for 2021 is forecast to grow by almost 1 mb/d to average 63.8 mb/d. The US liquids supply forecast remains unchanged, with growth of 0.16 mb/d in 2021, although uncertainties persist. The main contributors to supply growth are expected to be Canada, the US, Norway, Brazil and Russia. OPEC NGLs are forecast to grow by 0.08 mb/d in 2021 to average 5.2 mb/d, following a decline by 0.13 mb/d last year. In February, OPEC crude oil production decreased by 0.65 mb/d, m-o-m, to average 24.85 mb/d, according to secondary sources.
Product Markets and Refining Operations
Refinery margins showed diverging trends in February. In the US Gulf Coast and Asia, a rise in planned maintenance, unplanned outages and a subsequent decline in refinery intakes led to bullish market sentiment and provided support for fuel markets. Europe showed negative performance as refining economics experienced slight losses. The negative impacts of higher feedstock prices and higher product output, given the extension of mobility restrictions in some countries, have completely overshadowed support provided by robust product exports.
Tanker Market
Dirty tanker rates picked up in February, as a more than 20% increase in both Suezmax and Aframax spot freight rates outpaced a 6% decline in VLCCs. Weather was a key factor in boosting rates with weather delays in the Turkish straits and around the Mediterranean, lifting rates West of Suez amid a pickup in chartering activity. Unusual freezing weather in the US which struck in the middle of February led to disruptions in US crude and product trade flows, providing further support for Aframax as well as Suezmax rates amid limited availability in the Atlantic basin. Rising bunker fuel prices also provided some momentum for higher rates.
Crude and Refined Products Trade
A plunge in temperatures disrupted trade flows of US crude and products in February. US crude imports fell back from the strong levels seen in January, and hence crude exports were down around 1 mb/d in the second half of February relative to the first half due to the freezing weather and power outages on the US Gulf Coast. Meanwhile, Japan’s crude imports were stable in January, averaging 2.6 mb/d. A jump in heating demand for kerosene and fuel oil led to higher product imports and reduced exports. China’s crude imports surged above 11 mb/d in the first two months of 2021, as independent refiners returned to the market armed with fresh quotas. Net product exports were sharply higher. In India, crude imports remained at healthy levels in January, although lower m-o-m and y-o-y, averaging 4.6 mb/d. Product imports and exports also fell back from the strong performance seen the month before.
Commercial Stock Movements
Preliminary data shows that total OECD commercial oil stocks fell by 11.3 mb, m-o-m, in January. At 3,052 mb, inventories were 138.7 mb higher than the same month a year ago and 92.2 mb above the latest five-year average, 125.7 mb above the (2015-2019) average. Within the components, crude stocks declined by 17.7 mb, m-o-m, while product stocks increased by 6.4 mb over the same period. OECD crude stocks stood at 46.3 mb above the latest five-year average, 61.3 mb above the (2015-2019) average while product stocks exhibited a surplus of 45.9 mb, 64.3 mb above the (2015-2019) average. In terms of days of forward cover, OECD commercial inventories declined by 1.1 days, m-o-m, in January to stand at 69.6 days. This is 0.2 days lower than the year-ago level and 5.5 days above the latest five-year average, 7.8 days above the (2015-2019) average.
Balance of Supply and Demand
Demand for OPEC crude in 2020 is estimated at 22.4 mb/d, around 6.9 mb/d lower than in 2019. Demand for OPEC crude in 2021 is forecast to stand at 27.3 mb/d, around 4.9 mb/d higher than in 2020.
-----
Earlier:
2021, March, 11, 13:55:00
OIL PRICES RISKS
"As uncertainty, we note a possible increase in production by countries that are not members of OPEC+, as a result of rising prices," Novak said at the meeting with Putin, who praised his "efficient work" protecting Russia's share in the market.
2021, March, 10, 12:25:00
OIL PRICES 2021-22: $58-$59
Brent crude oil prices in the forecast average $58/b in the second half of 2021. Brent prices will average $59/b in 2022.
2021, March, 2, 12:30:00
OIL DEMAND WILL UP
Oil demand may continue to climb over the next decade even as countries work to comply with the Paris climate agreement’s goals for cutting emissions,
2021, February, 12, 11:55:00
OIL ISN'T ENOUGH FOR $3 TRLN
To meet the global cumulative demand over the next 30 years, undeveloped and undiscovered resources totaling 313 billion barrels of oil need to be added to currently producing assets.
2021, February, 10, 11:55:00
OIL PRICES 2021-22: $52-$56
Brent crude oil prices will average $56/b in the first quarter of 2021 and $52/b over the remainder of the year. Brent prices will average $55/b in 2022.
2021, February, 5, 12:40:00
OIL REMAINS THE FUEL
Petroleum remains the most-consumed fuel in the United States, as energy-related carbon dioxide emissions dip through 2035 before climbing in later years.
2021, February, 4, 16:35:00
OIL MARKET WILL BE GOOD: 2021
The global economy is forecast to grow by 4.4 per cent in 2021, a substantial shift from -4.1 per cent last year. “With the crude oil market currently switching into backwardation, we are hopeful that 2021 will be a good year for overall demand,” Barkindo said.


