2021-03-10 12:00:00


U.S. INTERNATIONAL TRADE DEFICIT UP TO $68.2 BLN
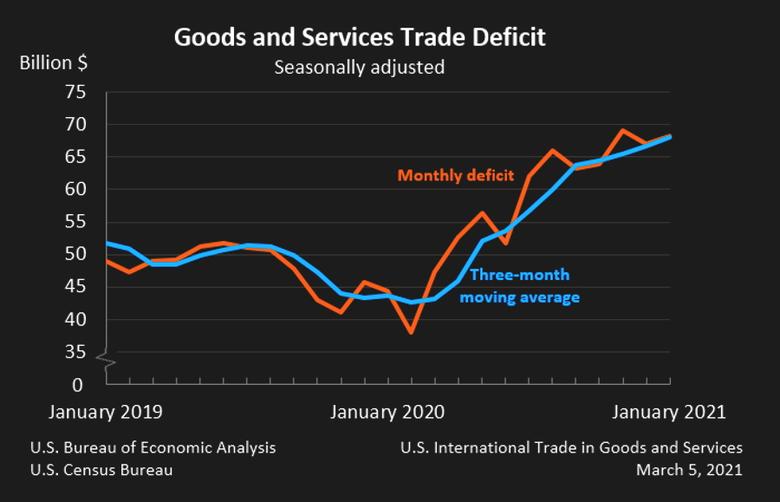
U.S. BEA - March 5, 2021 - The U.S. Census Bureau and the U.S. Bureau of Economic Analysis announced today that the goods and services deficit was $68.2 billion in January, up $1.2 billion from $67.0 billion in December, revised
| Deficit: |
$68.2 Billion |
+1.9%° |
| Exports: |
$191.9 Billion |
+1.0%° |
| Imports: |
$260.2 Billion |
+1.2%° |
|
Next release: Wednesday, April 7, 2021 (°) Statistical significance is not applicable or not measurable. Data adjusted for seasonality but not price changes Source: U.S. Census Bureau, U.S. Bureau of Economic Analysis; U.S. International Trade in Goods and Services, Friday, March 5, 2021 |
||
Exports, Imports, and Balance (exhibit 1)
January exports were $191.9 billion, $1.8 billion more than December exports. January imports were $260.2 billion, $3.1 billion more than December imports.
The January increase in the goods and services deficit reflected an increase in the goods deficit of $1.3 billion to $85.4 billion and an increase in the services surplus of $0.1 billion to $17.2 billion.
Year-over-year, the goods and services deficit increased $23.8 billion, or 53.7 percent, from January 2020. Exports decreased $15.7 billion or 7.6 percent. Imports increased $8.1 billion or 3.2 percent.
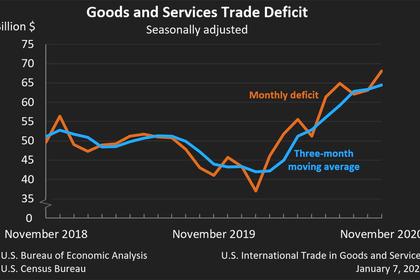
Three-Month Moving Averages (exhibit 2)
The average goods and services deficit increased $1.4 billion to $68.1 billion for the three months ending in January.
- Average exports increased $3.4 billion to $188.6 billion in January.
- Average imports increased $4.9 billion to $256.7 billion in January.
Year-over-year, the average goods and services deficit increased $24.4 billion from the three months ending in January 2020.
- Average exports decreased $21.3 billion from January 2020.
- Average imports increased $3.1 billion from January 2020.
Exports (exhibits 3, 6, and 7)
Exports of goods increased $2.1 billion to $135.7 billion in January.
Exports of goods on a Census basis increased $2.0 billion.
- Industrial supplies and materials increased $2.5 billion.
- Other petroleum products increased $0.6 billion.
- Plastic materials increased $0.4 billion.
- Nonmonetary gold decreased $0.4 billion.
- Capital goods increased $1.6 billion.
- Other industrial machinery increased $0.5 billion.
- Civilian aircraft increased $0.4 billion.
- Automotive vehicles, parts, and engines decreased $0.7 billion.
Net balance of payments adjustments increased less than $0.1 billion.
Exports of services decreased $0.3 billion to $56.3 billion in January.
- Transport decreased $0.1 billion.
- Travel decreased $0.1 billion.
Imports (exhibits 4, 6, and 8)
Imports of goods increased $3.4 billion to $221.1 billion in January.
Imports of goods on a Census basis increased $3.4 billion.
- Consumer goods increased $3.7 billion.
- Pharmaceutical preparations increased $5.0 billion.
- Artwork and other collectibles decreased $0.5 billion.
- Automotive vehicles, parts, and engines decreased $1.6 billion.
- Passenger cars increased $1.9 billion.
Net balance of payments adjustments decreased less than $0.1 billion.
Imports of services decreased $0.3 billion to $39.0 billion in January.
- Transport decreased $0.4 billion.
- Travel decreased $0.1 billion.
- Insurance services increased $0.1 billion.
Real Goods in 2012 Dollars – Census Basis (exhibit 11)
The real goods deficit increased $1.5 billion to $96.5 billion in January.
- Real exports of goods decreased $1.0 billion to $147.1 billion.
- Real imports of goods increased $0.5 billion to $243.6 billion.
Revisions
Exports and imports of goods and services were revised for July through December 2020 to incorporate more comprehensive and updated quarterly and monthly data. In addition to these revisions, seasonally adjusted data for all months in 2020 were revised so that the totals of the seasonally adjusted months equal the annual totals.
Revisions to December exports
- Exports of goods were revised up $0.1 billion.
- Exports of services were revised up $0.1 billion.
Revisions to December imports
- Imports of goods were revised up $0.1 billion.
- Imports of services were revised up $0.5 billion.
Goods by Selected Countries and Areas: Monthly – Census Basis (exhibit 19)
The January figures show surpluses, in billions of dollars, with South and Central America ($5.3), Hong Kong ($2.4), Brazil ($1.5), Saudi Arabia ($0.5), and United Kingdom ($0.5). Deficits were recorded, in billions of dollars, with China ($27.2), European Union ($20.1), Mexico ($11.9), Germany ($7.2), Japan ($5.2), Italy ($2.9), France ($2.3), India ($2.3), Taiwan ($2.1), Canada ($2.0), South Korea ($0.9), and Singapore ($0.1).
- The deficit with Mexico increased $1.6 billion to $11.9 billion in January. Exports increased $0.1 billion to $20.7 billion and imports increased $1.6 billion to $32.6 billion.
- The deficit with Germany increased $1.5 billion to $7.2 billion in January. Exports decreased $0.2 billion to $4.7 billion and imports increased $1.3 billion to $12.0 billion.
- The deficit with South Korea decreased $1.8 billion to $0.9 billion in January. Exports increased $1.3 billion to $5.7 billion and imports decreased $0.5 billion to $6.6 billion.
Goods and Services by Selected Countries and Areas: Quarterly – Balance of Payments Basis (exhibit 20)
Statistics on trade in goods and services by country and area are only available quarterly, with a one-month lag. With this release, fourth-quarter figures are now available.
The fourth-quarter figures show surpluses, in billions of dollars, with South and Central America ($13.2), Hong Kong ($6.3), Brazil ($4.2), United Kingdom ($4.0), Saudi Arabia ($3.7), and Singapore ($2.0). Deficits were recorded, in billions of dollars, with China ($80.0), European Union ($36.8), Mexico ($33.6), Germany ($17.1), Japan ($16.7), India ($10.1), Italy ($8.9), Taiwan ($8.7), South Korea ($7.0), France ($4.0), and Canada ($0.3).
- The deficit with the European Union increased $6.5 billion to $36.8 billion in the fourth quarter. Exports increased $5.1 billion to $103.5 billion and imports increased $11.7 billion to $140.3 billion.
- The deficit with China increased $4.2 billion to $80.0 billion in the fourth quarter. Exports increased $7.9 billion to $49.4 billion and imports increased $12.1 billion to $129.3 billion.
- The surplus with Hong Kong increased $1.5 billion to $6.3 billion in the fourth quarter. Exports increased $1.3 billion to $9.6 billion and imports decreased $0.2 billion to $3.3 billion.
-----
Earlier:
2021, February, 24, 10:25:00
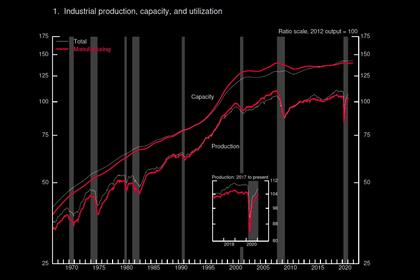
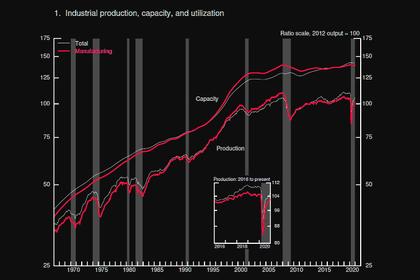
U.S. INDUSTRIAL PRODUCTION UP 0.9%
U.S. industrial production increased 0.9 percent in January.
2021, February, 8, 12:30:00
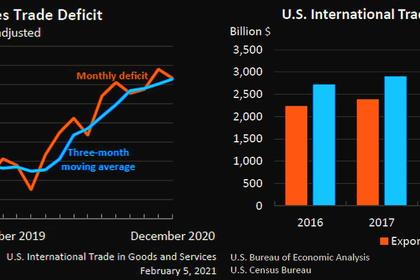
U.S. INTERNATIONAL TRADE DEFICIT DOWN TO $66.6 BLN
the U.S. goods and services deficit was $66.6 billion in December, down $2.4 billion from $69.0 billion in November
2021, January, 28, 12:35:00
U.S. FEDERAL FUNDS RATE 0.0 - 0.25% ANEW
The Committee decided to keep the target range for the federal funds rate at 0 to 1/4 percent
2021, January, 18, 12:55:00
U.S. INDUSTRIAL PRODUCTION UP 1.6%
U.S. industrial production advanced 1.6 percent in December, with gains of 0.9 percent for manufacturing, 1.6 percent for mining, and 6.2 percent for utilities.
2021, January, 8, 15:15:00
U.S. INTERNATIONAL TRADE DEFICIT UP TO $68 BLN
the U.S. goods and services deficit was $68.1 billion in November, up $5.0 billion from $63.1 billion in October
2020, December, 21, 12:35:00
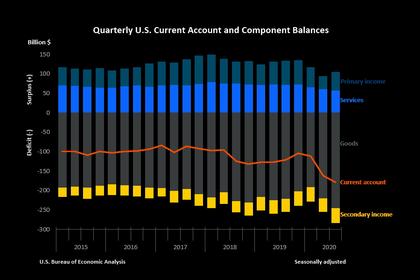
U.S. CURRENT ACCOUNT DEFICIT UP TO $178.5 BLN
The U.S. current account deficit, which reflects the combined balances on trade in goods and services and income flows between U.S. residents and residents of other countries, widened by $17.2 billion, or 10.6 percent, to $178.5 billion in the third quarter of 2020


