2021-04-14 12:15:00


GLOBAL OIL DEMAND WILL UP BY 6 MBD
OPEC - 13 April 2021 - OPEC MONTHLY OIL MARKET REPORT
Oil Market Highlights
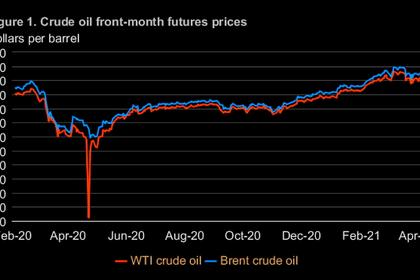
Crude Oil Price Movements
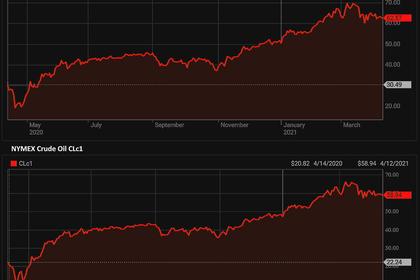
Spot crude prices rose for the fifth-consecutive month in March on the back of continuing supportive oil market fundamentals. The OPEC Reference Basket (ORB) increased $3.51 or 5.7% m-o-m to average $64.56/b, the highest on monthly terms since January 2020. In the first three months of 2021, the ORB was up by $8.82, or 17.2% to average $60.22/b. Crude oil futures prices were higher in March extending previous monthly gains.
The ICE Brent front month rose by $3.42 in March, or 5.5%, to average $65.70/b, and NYMEX WTI increased by $3.30, or 5.6%, to average $62.36/b. Consequently, the Brent-WTI spread widened to $3.34/b on a monthly average. The backwardation structure of Brent and WTI markets eased over the month, specifically in the front of the forward curve. In contrast, backwardation strengthened for DME Oman and Dubai. Hedge funds and other money managers liquidated part of their bullish positions in the second half of March after market sentiment softened.
World Economy
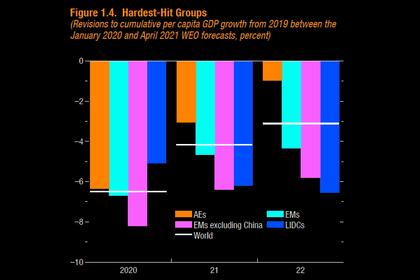
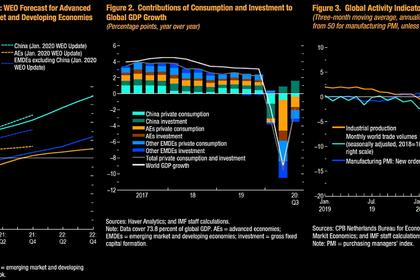
The global economic contraction estimate in 2020 is reduced after a better-than-expected actual performance by a number of economies in 2H20. As a result, global economic growth now shows a decline of 3.5% y-o-y in 2020. For 2021, additional US stimulus measures and an accelerating recovery in Asian economies are expected to continue supporting the global economic growth forecast, which is now revised up to 5.4%.
However, this forecast remains clouded by uncertainties, including, but not limited to, the spread of COVID-19 variants and the speed of the vaccine rollout. In addition, sovereign debt levels in many regions, inflationary pressures, and central bank responses are key factors to monitor. After a contraction of 3.5% in 2020, US economic growth in 2021 is now expected to reach 5.7%. The GDP growth forecast for the Euro-zone in 2021 remains at 4.3%, which follows a contraction of 6.8% last year. Japan’s GDP growth forecast remains at 3.1% for 2021, after a contraction of 4.9% in 2020. Following growth of 2.3% in 2020, China’s GDP is forecast to increase by 8.4% in 2021. India’s 2021 GDP growth forecast is revised up to 9.8%, compared to a contraction of 7% in 2020. Brazil’s growth forecast remains unchanged at 3.0%, with government estimates showing Brazil’s economy contracted by 4.1% in 2020. Russia’s growth forecast for 2021 remains at 3%, after contracting by 3.1% in 2020.
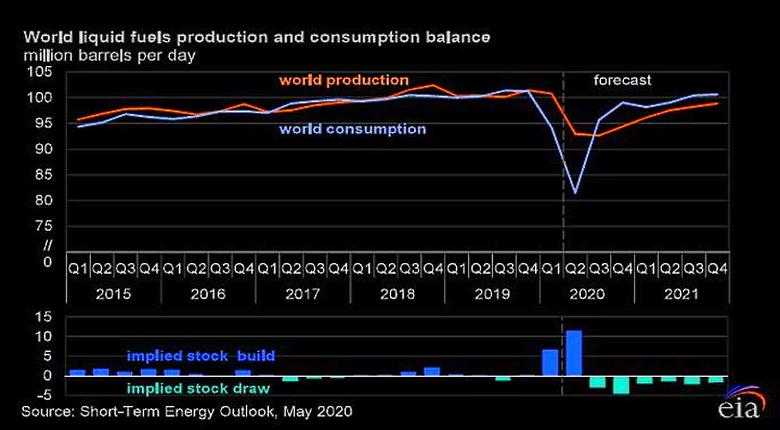
World Oil Demand
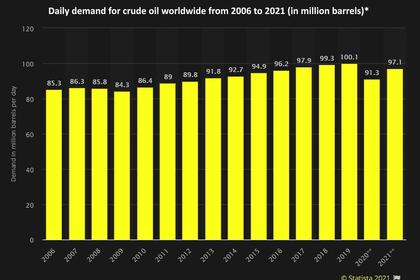
The global oil demand contraction in 2020 is revised lower by about 0.1 mb/d compared to last month’s MOMR, now showing a contraction of about 9.5 mb/d y-o-y, with total world oil demand at 90.5 mb/d. In 2021, world oil demand growth is expected to increase by about 6.0 mb/d y-o-y, representing an upward revision of about 0.1 mb/d from last month’s report. Indeed, oil demand in the 2H21 is projected to be positively impacted by a stronger economic rebound than assumed last month, supported by stimulus programmes and a further easing of COVID-19 lockdown measures, amid an acceleration in the vaccination rollout, largely in the OECD region.
Nevertheless, oil demand was adjusted lower in 1H21, mainly taking into account the recent developments related to COVID-19 measures in OECD Europe and sluggish 1Q21 oil demand data from the non-OECD region. As a result, global oil demand is expected to average about 96.5 mb/d in 2021.
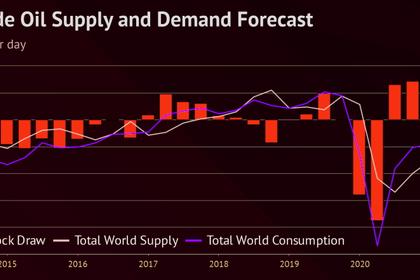
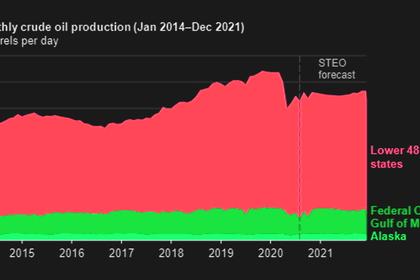
World Oil Supply
Non-OPEC liquids supply in 2020 is estimated to average 62.9 mb/d, showing a contraction of 2.5 mb/d y-o-y, which is an upward revision of 0.04 mb/d m-o-m. The majority of the decline came from Russia and the US. Non-OPEC liquids supply for 2021 is revised down by 0.03 mb/d from last month and is now forecast to grow by 0.9 mb/d to an average of 63.8 mb/d. In the US, higher prices could potentially translate into a higher level of production in 2021, with the drilling and completion trend indicating possible future robust monthly growth. However, the US liquids supply forecast in 2021 is expected to remain unchanged at growth of 0.16 mb/d y-o-y. The other main drivers for supply growth in 2021 are expected to be Canada, Norway and Brazil. OPEC NGLs are forecast to grow by around 0.1 mb/d y-o-y in 2021 to average 5.2 mb/d, following an estimated contraction of 0.1 mb/d in 2020. OPEC crude oil production in March increased by 0.20 mb/d, m-o-m, to average 25.04 mb/d, according to secondary sources.
Product Markets and Refining Operations
Refining margins showed diverging trends in March. In the USGC margins jumped, as product markets continued to benefit from the recent rise in unplanned outages, as well as low refinery output levels due to heavy maintenance. This led to a tighter overall product balance and bullish product market sentiment, which helped keep fuel prices sustained. In Europe, refinery margins also rose, but rather moderately. On the other hand, margins in Asia performed negatively as refining economics saw losses as pressure came mainly from the middle of the barrel as the market remained well supplied.
Tanker Market
Dirty tanker spot freight rates picked up in March, as gains in Suezmax and Aframax outpaced a further slight decline in VLCCs. Increases in the these vessel classes were driven by tighter tanker supply as the blockage of the Suez Canal kept ships waiting on both sides of the waterway amid uncertainties regarding when the disruption would be resolved. After the container ship ‘Ever Given’ was dislodged at the end of the month, rates fell back toward the lower levels seen at the start of the year. The impending emergence of 2Q refinery maintenance in Asia also reduced support by the end of the month. Clean tanker rates in March saw an improved performance East of Suez, while West of Suez routes around the Med eased from the higher levels seen last month.
Crude and Refined Products Trade
Preliminary data shows that US crude imports were flat in March at around 5.7 mb/d for the fourth month in a row, while US crude exports declined for the third month in a row, averaging 2.7 mb/d, the lowest since July 2019. US product imports surged in March to average 2.5 mb/d, the highest since July 2019, as weather disruptions supported inflows. Japan’s crude imports were broadly stable at the stronger levels seen over the past two months, averaging 2.6 mb/d in February. Product imports were the highest in over three years, averaging 1.3 mb/d in February. China’s crude imports achieved a four-month high in February, averaging 11.8 mb/d, impacted by the Lunar New Year Holidays and stronger buying by independent refiners. Product exports edged up 3% to average 1.5 mb/d, the highest since April 2020, driven by gasoil and jet fuel. India’s crude imports declined sharply in February, averaging just under 4 mb/d, the lowest in four months, as COVID-19 impacts and higher prices weighed on demand. Product imports rebounded in February, to average 1.2 mb/d, the highest in 13 months, driven by LPG inflows, part of a government programme to promote clean cooking.
Commercial Stock Movements
Preliminary data shows that total OECD commercial oil stocks fell by 44.9 mb m-o-m in February. At 2,978 mb, inventories were 94.1 mb higher than the same month a year ago, 29 mb above the latest five-year average, and around 57 mb above the 2015-2019 average. Within the components, crude stocks rose by 6.1 mb, m-o-m, while product stocks fell by 51.0 mb. OECD crude stocks were 30.8 mb above the latest five-year average and 42.0 mb above the 2015-2019 average, while product stocks exhibited a deficit of 1.7 mb to the latest five-year average, but were 15.5 mb above the 2015-2019 average. In terms of days of forward cover, OECD commercial inventories declined m-o-m by 1.1 days in February to stand at 68.0 days. This is 6.7 days lower than the year-ago level, 2.6 days above the latest five-year average, and 5.6 days above the 2015–2019 average.
Balance of Supply and Demand
Demand for OPEC crude in 2020 is revised up by 0.1 mb/d from the previous month to stand at 22.5 mb/d. This is around 6.8 mb/d lower than in 2019. For 2021, demand for OPEC crude is revised up by 0.2 mb/d from the previous month to stand at 27.4 mb/d. This is 4.9 mb/d higher than in 2020.
-----
Earlier:
2021, April, 12, 10:38:47
OIL PRICE: NEAR $63 STILL
Brent was up 2 cents at $62.97 a barrel. WTI gained 1 cent to $59.49 a barrel.
2021, April, 12, 10:20:00
OPEC+ OIL PRODUCTION UP 450 TBD
With the production gains, OPEC+ compliance with its quotas slipped to 111% in March, compared with 113.5% in February, juiced by Saudi Arabia voluntarily cutting an additional 1 million b/d since January.
2021, April, 12, 10:15:00
U.S. OIL TAX BREAKS $35 BLN
Removing this specific tax measure could generate US$13bn over 10 years. Overall, eliminating fossil fuel subsidies could increase government receipts by US$35bn over 10 years.
2021, April, 7, 10:35:00
OIL PRICES 2021-22: $65-60
EIA forecasts that Brent prices will average $65/b in the second quarter of 2021, $61/b during the second half of 2021, and $60/b in 2022.
2021, April, 7, 10:25:00
GLOBAL GROWTH UP 6%: 2021
Global growth is projected at 6 percent in 2021, moderating to 4.4 percent in 2022.
2021, March, 12, 11:55:00
GLOBAL OIL DEMAND WILL UP BY 5.9 MBD
For 2021, world oil demand is expected at 5.9 mb/d, to stand at 96.3 mb/d.
2021, January, 27, 14:10:00
GLOBAL ECONOMY WILL UP 5.5%
The global economy is projected to grow 5.5 percent in 2021 and 4.2 percent in 2022.


