2021-04-05 11:15:00


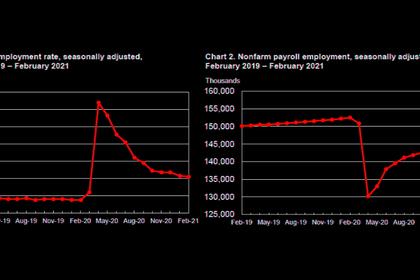
U.S. UNEMPLOYMENT DOWN TO 6.0%
U.S. BLS - April 2, 2021 - THE EMPLOYMENT SITUATION -- MARCH 2021
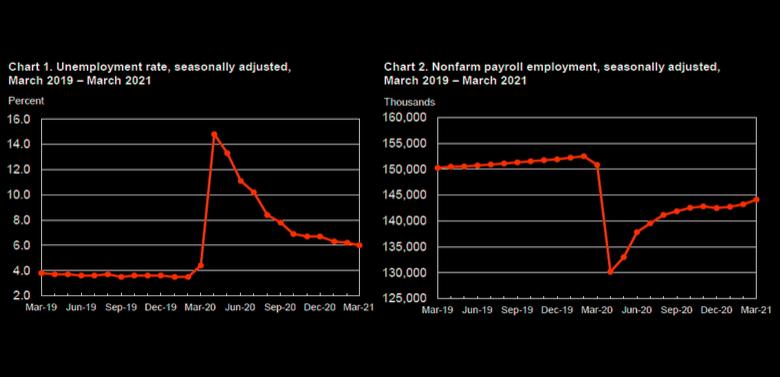
Total nonfarm payroll employment rose by 916,000 in March, and the unemployment rate edged down to 6.0 percent, the U.S. Bureau of Labor Statistics reported today. These improvements in the labor market reflect the continued resumption of economic activity that had been curtailed due to the coronavirus (COVID-19) pandemic. Job growth was widespread in March, led by gains in leisure and hospitality, public and private education, and construction.
This news release presents statistics from two monthly surveys. The household survey measures labor force status, including unemployment, by demographic characteristics. The establishment survey measures nonfarm employment, hours, and earnings by industry. For more information about the concepts and statistical methodology used in these two surveys, see the Technical Note.
Household Survey Data
The unemployment rate edged down to 6.0 percent in March. The rate is down considerably from its recent high in April 2020 but is 2.5 percentage points higher than its pre- pandemic level in February 2020. The number of unemployed persons, at 9.7 million, continued to trend down in March but is 4.0 million higher than in February 2020. (See table A-1. See the box note at the end of this news release for more information about how the household survey and its measures were affected by the coronavirus pandemic.)
Among the major worker groups, the unemployment rate for Asians rose to 6.0 percent in March, following a decline in the previous month. The jobless rate for Hispanics edged down to 7.9 percent over the month, while the rates for adult men (5.8 percent), adult women (5.7 percent), teenagers (13.0 percent), Whites (5.4 percent), and Blacks (9.6 percent) changed little. (See tables A-1, A-2, and A-3.)
Among the unemployed, the number of persons on temporary layoff declined by 203,000 in March to 2.0 million. This measure is down considerably from the recent high of 18.0 million in April 2020 but is 1.3 million higher than in February 2020. The number of permanent job losers, at 3.4 million, was little changed in March but is 2.1 million higher than February 2020. (See table A-11.)
The number of long-term unemployed (those jobless for 27 weeks or more), at 4.2 million, changed little over the month but is up by 3.1 million since February 2020. In March, these long-term unemployed accounted for 43.4 percent of the total unemployed. The number of persons jobless 5 to 14 weeks declined by 313,000 to 1.9 million. The number of persons jobless less than 5 weeks, at 2.2 million, was essentially unchanged over the month. (See table A-12.)
The labor force participation rate changed little at 61.5 percent in March. This measure is 1.8 percentage points lower than in February 2020. The employment-population ratio, at 57.8 percent, was up by 0.2 percentage point over the month but is 3.3 percentage points lower than in February 2020. (See table A-1.)
The number of persons employed part time for economic reasons, at 5.8 million, changed little in March but is 1.4 million higher than in February 2020. These individuals, who would have preferred full-time employment, were working part time because their hours had been reduced or they were unable to find full-time jobs. (See table A-8.) The number of persons not in the labor force who currently want a job was about unchanged at 6.9 million in March but is up by 1.8 million since February 2020. These individuals were not counted as unemployed because they were not actively looking for work during the last 4 weeks or were unavailable to take a job. (See table A-1.)
Among those not in the labor force who currently want a job, the number of persons marginally attached to the labor force, at 1.9 million, was essentially unchanged in March but is up by 416,000 since February 2020. These individuals wanted and were available for work and had looked for a job sometime in the prior 12 months but had not looked for work in the 4 weeks preceding the survey. The number of discouraged workers, a subset of the marginally attached who believed that no jobs were available for them, was 523,000 in March, essentially unchanged from the previous month. (See Summary table A.)
Household Survey Supplemental Data
In March, 21.0 percent of employed persons teleworked because of the coronavirus pandemic, down from 22.7 percent in the prior month. These data refer to employed persons who teleworked or worked at home for pay at some point in the last 4 weeks specifically because of the pandemic.
In March, 11.4 million persons reported that they had been unable to work because their employer closed or lost business due to the pandemic--that is, they did not work at all or worked fewer hours at some point in the last 4 weeks due to the pandemic. This measure is down from 13.3 million in the previous month. Among those who reported in March that they were unable to work because of pandemic-related closures or lost business, 10.2 percent received at least some pay from their employer for the hours not worked, little changed from the previous month.
Among those not in the labor force in March, 3.7 million persons were prevented from looking for work due to the pandemic. This measure is down from 4.2 million the month before. (To be counted as unemployed, by definition, individuals must be either actively looking for work or on temporary layoff.)
These supplemental data come from questions added to the household survey beginning in May 2020 to help gauge the effects of the pandemic on the labor market. The data are not seasonally adjusted. Tables with estimates from the supplemental questions for all months are available online at www.bls.gov/cps/effects-of-the-coronavirus-covid-19-pandemic.htm.
Establishment Survey Data
Total nonfarm payroll employment increased by 916,000 in March but is down by 8.4 million, or 5.5 percent, from its pre-pandemic peak in February 2020. Job growth in March was widespread, with the largest gains occurring in leisure and hospitality, public and private education, and construction. (See table B-1. See the box note at the end of this news release for more information about how the establishment survey and its measures were affected by the coronavirus pandemic.)
In March, employment in leisure and hospitality increased by 280,000, as pandemic-related restrictions eased in many parts of the country. Nearly two-thirds of the increase was in food services and drinking places (+176,000). Job gains also occurred in arts, entertainment, and recreation (+64,000) and in accommodation (+40,000). Employment in leisure and hospitality is down by 3.1 million, or 18.5 percent, since February 2020.
In March, employment increased in both public and private education, reflecting the continued resumption of in-person learning and other school-related activities in many parts of the country. Employment rose by 76,000 in local government education, by 50,000 in state government education, and by 64,000 in private education. Employment is down from February 2020 in local government education (-594,000), state government education (-270,000), and private education (-310,000).
Construction added 110,000 jobs in March, following job losses in the previous month (-56,000) that were likely weather-related. Employment growth in the industry was widespread in March, with gains of 65,000 in specialty trade contractors, 27,000 in heavy and civil engineering construction, and 18,000 in construction of buildings. Employment in construction is 182,000 below its February 2020 level.
Employment in professional and business services rose by 66,000 over the month but is down by 685,000 since February 2020. In March, employment in administrative and support services continued to trend up (+37,000), although employment in its temporary help services component was essentially unchanged. Employment also continued on an upward trend in management and technical consulting services (+8,000) and in computer systems design and related services (+6,000).
Manufacturing employment rose by 53,000 in March, with job gains occurring in both durable goods (+30,000) and nondurable goods (+23,000). Employment in manufacturing is down by 515,000 since February 2020.
Transportation and warehousing added 48,000 jobs in March. Employment increased in couriers and messengers (+17,000), transit and ground passenger transportation (+13,000), support activities for transportation (+6,000), and air transportation (+6,000). Since February 2020, employment in couriers and messengers is up by 206,000 (or 23.3 percent), while employment is down by 112,000 (or 22.8 percent) in transit and ground passenger transportation and by 104,000 (or 20.1 percent) in air transportation.
Employment in the other services industry increased by 42,000 over the month, reflecting job gains in personal and laundry services (+19,000) and in repair and maintenance (+18,000). Employment in other services is down by 396,000 since February 2020.
Social assistance added 25,000 jobs in March, mostly in individual and family services (+20,000). Employment in social assistance is 306,000 lower than in February 2020.
Employment in wholesale trade increased by 24,000 in March, with job gains in both durable goods (+14,000) and nondurable goods (+10,000). Employment in wholesale trade is 234,000 lower than in February 2020.
Retail trade added 23,000 jobs in March. Job growth in clothing and clothing accessories stores (+16,000), motor vehicle and parts dealers (+13,000), and furniture and home furnishing stores (+6,000) was partially offset by losses in building material and garden supply stores (-9,000) and general merchandise stores (-7,000). Employment in retail
trade is 381,000 below its February 2020 level.
Employment in mining rose by 21,000 in March, largely in support activities for mining (+19,000). Mining employment is down by 130,000 since a peak in January 2019.
Financial activities added 16,000 jobs in March. Job gains in insurance carriers and related activities (+11,000) and real estate (+10,000) more than offset losses in credit intermediation and related activities (-7,000). Financial activities has 87,000 fewer jobs than in February 2020.
Employment in health care and information changed little in March. In March, average hourly earnings for all employees on private nonfarm payrolls fell by 4 cents to $29.96. Average hourly earnings for private-sector production and nonsupervisory employees, at $25.21, changed little (+2 cents). The large employment fluctuations over the past year--especially in industries with lower-paid workers-- complicate the analysis of recent trends in average hourly earnings. (See tables B-3 and B-8.)
The average workweek for all employees on private nonfarm payrolls increased by 0.3 hour to 34.9 hours in March, following a decline of 0.4 hour in the prior month. In manufacturing, the workweek increased by 0.2 hour to 40.5 hours over the month, and overtime increased by 0.1 hour to 3.3 hours. The average workweek for production and nonsupervisory employees on private nonfarm payrolls rose by 0.3 hour to 34.3 hours. (See tables B-2 and B-7.)
The change in total nonfarm payroll employment for January was revised up by 67,000, from +166,000 to +233,000, and the change for February was revised up by 89,000, from +379,000 to +468,000. With these revisions, employment in January and February combined was 156,000 higher than previously reported. (Monthly revisions result from additional reports received from businesses and government agencies since the last published estimates and from the recalculation of seasonal factors.)
-----
Earlier:
2021, March, 26, 11:55:00
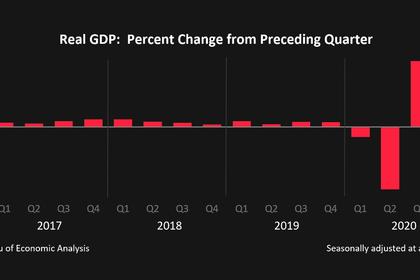
U.S. GDP UP 4.3%
Real gross domestic product (GDP) increased at an annual rate of 4.3 percent in the fourth quarter of 2020
2021, March, 18, 11:55:00
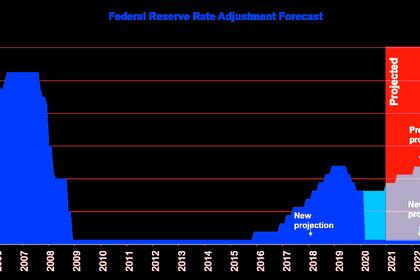
U.S. FEDERAL FUNDS RATE 0.0 - 0.25% AGAIN
The Committee decided to keep the target range for the federal funds rate at 0 to 1/4 percent
2021, March, 17, 14:10:00
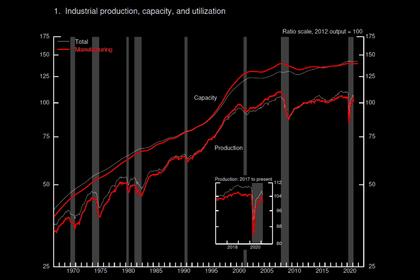
U.S. INDUSTRIAL PRODUCTION DOWN 2.2%
U.S. industrial production decreased 2.2 percent in February.
2021, March, 11, 13:25:00
U.S. EMPLOYMENT UP
Total nonfarm payroll employment rose by 379,000 in February, and the unemployment rate was little changed at 6.2 percent,
2021, March, 10, 12:20:00
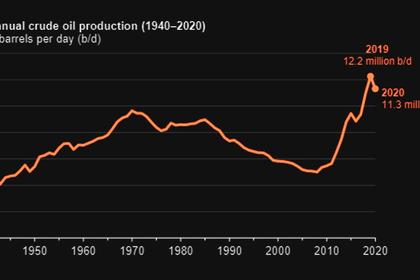
U.S. OIL PRODUCTION DOWN 8%
U.S. crude oil production averaged 11.3 million barrels per day (b/d) in 2020, down 935,000 b/d (8%) from the record annual average high of 12.2 million b/d in 2019.
2021, March, 10, 12:00:00
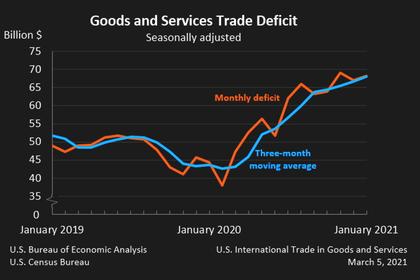
U.S. INTERNATIONAL TRADE DEFICIT UP TO $68.2 BLN
the goods and services deficit was $68.2 billion in January, up $1.2 billion from $67.0 billion in December,