2021-05-13 17:15:00


U.S. INTERNATIONAL TRADE DEFICIT UP TO $74.4 BLN
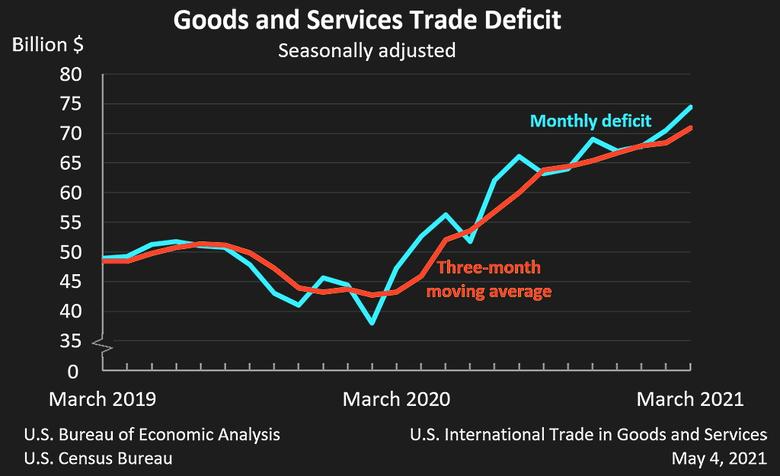
U.S. BEA - May 4, 2021- The U.S. Census Bureau and the U.S. Bureau of Economic Analysis announced today that the goods and services deficit was $74.4 billion in March, up $3.9 billion from $70.5 billion in February, revised.
| Deficit: |
$74.4 Billion |
+5.6%° |
| Exports: |
$200.0 Billion |
+6.6%° |
| Imports: |
$274.5 Billion |
+6.3%° |
|
Next release: Tuesday, June 8, 2021 (°) Statistical significance is not applicable or not measurable. Data adjusted for seasonality but not price changes Source: U.S. Census Bureau, U.S. Bureau of Economic Analysis; U.S. International Trade in Goods and Services, May 4, 2021 |
||
Exports, Imports, and Balance (exhibit 1)
March exports were $200.0 billion, $12.4 billion more than February exports. March imports were $274.5 billion, $16.4 billion more than February imports.
The March increase in the goods and services deficit reflected an increase in the goods deficit of $3.6 billion to $91.6 billion and a decrease in the services surplus of $0.3 billion to $17.1 billion.
Year-to-date, the goods and services deficit increased $83.2 billion, or 64.2 percent, from the same period in 2020. Exports decreased $21.0 billion or 3.5 percent. Imports increased $62.2 billion or 8.5 percent.
Three-Month Moving Averages (exhibit 2)
The average goods and services deficit increased $2.5 billion to $70.9 billion for the three months ending in March.
- Average exports increased $3.3 billion to $193.3 billion in March.
- Average imports increased $5.8 billion to $264.2 billion in March.
Year-over-year, the average goods and services deficit increased $27.7 billion from the three months ending in March 2020.
- Average exports decreased $7.0 billion from March 2020.
- Average imports increased $20.7 billion from March 2020.
Exports (exhibits 3, 6, and 7)
Exports of goods increased $11.7 billion to $142.9 billion in March.
Exports of goods on a Census basis increased $11.7 billion.
- Industrial supplies and materials increased $5.2 billion.
- Nonmonetary gold increased $3.4 billion.
- Natural gas decreased $1.7 billion.
- Capital goods increased $2.9 billion.
- Semiconductors increased $0.4 billion.
- Electric apparatus increased $0.4 billion.
- Consumer goods increased $2.0 billion.
- Artwork and other collectibles increased $0.4 billion.
- Gem diamonds increased $0.4 billion.
Net balance of payments adjustments decreased less than $0.1 billion.
Exports of services increased $0.8 billion to $57.1 billion in March.
- Travel increased $0.4 billion.
- Transport increased $0.3 billion.
- Financial services increased $0.1 billion.
Imports (exhibits 4, 6, and 8)
Imports of goods increased $15.3 billion to $234.4 billion in March.
Imports of goods on a Census basis increased $15.3 billion.
- Consumer goods increased $4.5 billion.
- Other textile apparel and household goods increased $1.2 billion.
- Furniture and household goods increased $0.9 billion.
- Toys, games, and sporting goods increased $0.9 billion.
- Cell phones and other household goods decreased $1.0 billion.
- Industrial supplies and materials increased $3.7 billion.
- Other petroleum products increased $0.8 billion.
- Crude oil increased $0.6 billion.
- Fuel oil increased $0.6 billion.
- Finished metal shapes decreased $1.3 billion.
- Capital goods increased $3.3 billion.
- Semiconductors increased $1.3 billion.
- Other industrial machinery increased $0.5 billion.
- Telecommunications equipment increased $0.5 billion.
- Civilian aircraft decreased $1.4 billion.
- Automotive vehicles, parts, and engines increased $2.0 billion.
- Passenger cars increased $1.0 billion.
- Automotive parts and accessories increased $0.7 billion.
Net balance of payments adjustments increased less than $0.1 billion.
Imports of services increased $1.1 billion to $40.0 billion in March.
- Transport increased $0.9 billion.
- Travel increased $0.1 billion.
Real Goods in 2012 Dollars – Census Basis (exhibit 11)
The real goods deficit increased $4.2 billion to $103.1 billion in March.
- Real exports of goods increased $9.3 billion to $148.7 billion.
- Real imports of goods increased $13.4 billion to $251.8 billion.
Revisions
Revisions to February exports
- Exports of goods were revised up $0.1 billion.
- Exports of services were revised up $0.2 billion.
Revisions to February imports
- Imports of goods were revised up less than $0.1 billion.
- Imports of services were revised down $0.2 billion.
Goods by Selected Countries and Areas: Monthly – Census Basis (exhibit 19)
The March figures show surpluses, in billions of dollars, with South and Central America ($3.6), Hong Kong ($2.9), Brazil ($1.0), Singapore ($0.6), and United Kingdom ($0.1). Deficits were recorded, in billions of dollars, with China ($36.9), European Union ($16.9), Mexico ($8.4), Germany ($5.5), Japan ($5.1), Canada ($3.1), Italy ($2.9), Taiwan ($2.6), India ($2.2), South Korea ($2.1), France ($1.5), and Saudi Arabia (less than $0.1).
- The deficit with China increased $6.7 billion to $36.9 billion in March. Exports increased $0.9 billion to $11.3 billion and imports increased $7.6 billion to $48.2 billion.
- The deficit with Mexico increased $1.6 billion to $8.4 billion in March. Exports decreased $0.6 billion to $22.2 billion and imports increased $1.0 billion to $30.6 billion.
- The deficit with the European Union decreased $2.1 billion to $16.9 billion in March. Exports decreased $0.5 billion to $20.1 billion and imports decreased $2.6 billion to $37.0 billion.
-----
Earlier:
2021, April, 16, 11:45:00
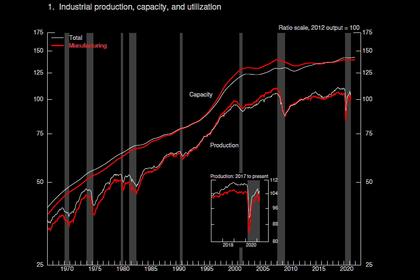
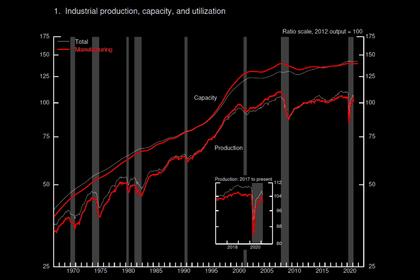
U.S. INDUSTRIAL PRODUCTION UP 1.4%
U.S. industrial production increased 1.4 percent in Murch.
2021, April, 8, 11:30:00
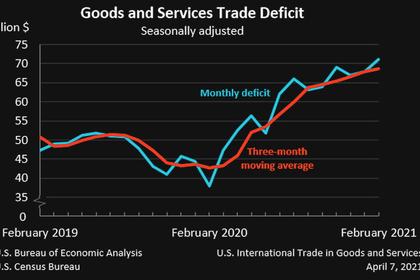
U.S. INTERNATIONAL TRADE DEFICIT UP TO $71.1 BLN
The U.S. Census Bureau and the U.S. Bureau of Economic Analysis announced today that the goods and services deficit was $71.1 billion in February, up $3.3 billion from $67.8 billion in January, revised.
2021, April, 5, 11:15:00
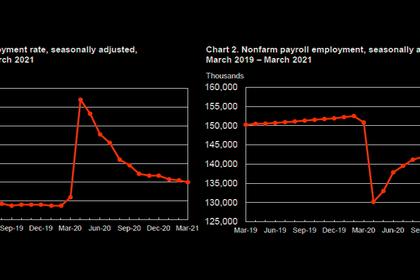
U.S. UNEMPLOYMENT DOWN TO 6.0%
Total nonfarm payroll employment rose by 916,000 in March, and the unemployment rate edged down to 6.0 percent,
2021, March, 26, 11:55:00
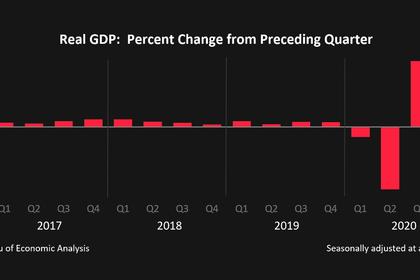
U.S. GDP UP 4.3%
Real gross domestic product (GDP) increased at an annual rate of 4.3 percent in the fourth quarter of 2020
2021, March, 18, 11:55:00
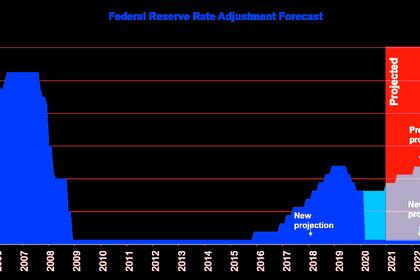
U.S. FEDERAL FUNDS RATE 0.0 - 0.25% AGAIN
The Committee decided to keep the target range for the federal funds rate at 0 to 1/4 percent
2021, March, 17, 14:10:00
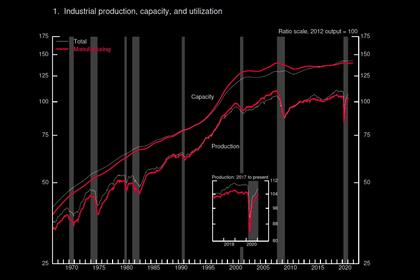
U.S. INDUSTRIAL PRODUCTION DOWN 2.2%
U.S. industrial production decreased 2.2 percent in February.
2021, February, 24, 10:25:00
U.S. INDUSTRIAL PRODUCTION UP 0.9%
U.S. industrial production increased 0.9 percent in January.


