2021-05-18 13:00:00
U.S. PRODUCTION: OIL +26 TBD, GAS (-53) MCFD
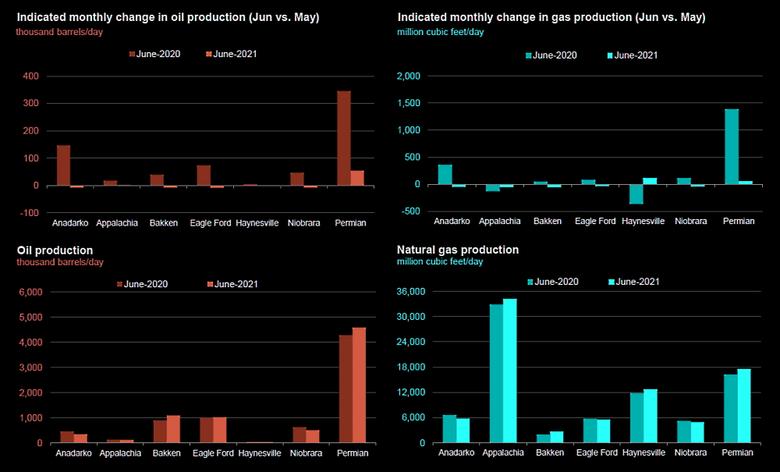
U.S. EIA - May 17, 2021 - Crude oil production from the major US onshore regions is forecast to increase 26,000 b/d month-over-month in June 2021 from 7,707 to 7,733 thousand barrels/day, gas production to decrease 53 million cubic feet/day from 83,624 to 83,571 million cubic feet/day .
NOTE: The Drilling Productivity Report (DPR) rig productivity metric new-well oil/natural gas production per rig can become unstable during periods of rapid decreases or increases in the number of active rigs and well completions. The metric uses a fixed ratio of estimated total production from new wells divided by the region's monthly rig count, lagged by two months. The metric does not represent new-well oil/natural gas production per newly completed well.
The DPR metric legacy oil/natural gas production change can become unstable during periods of rapid decreases or increases in the volume of well production curtailments or shut-ins. This effect has been observed during winter weather freeze-offs, extreme flooding events, and the 2020 global oil demand contraction. The DPR methodology involves applying smoothing techniques to most of the data series because of inherent noise in the data.
The DPR metric legacy oil/natural gas production change can become unstable during periods of rapid decreases or increases in the volume of well production curtailments or shut-ins. This effect has been observed during winter weather freeze-offs, extreme flooding events, and the 2020 global oil demand contraction. The DPR methodology involves applying smoothing techniques to most of the data series because of inherent noise in the data.
| New-well oil production per rig barrels/day | New-well gas production per rig thousand cubic feet/day | |||||
|---|---|---|---|---|---|---|
| Region | May 2021 | June 2021 | change | May 2021 | June 2021 | change |
| Anadarko | 1,031 | 1,029 | (2) | 5,575 | 5,564 | (11) |
| Appalachia | 184 | 186 | 2 | 27,985 | 28,335 | 350 |
| Bakken | 2,423 | 2,413 | (10) | 3,223 | 3,210 | (13) |
| Eagle Ford | 2,326 | 2,329 | 3 | 7,832 | 7,911 | 79 |
| Haynesville | 19 | 19 | - | 11,468 | 11,479 | 11 |
| Niobrara | 1,934 | 1,933 | (1) | 5,429 | 5,418 | (11) |
| Permian | 1,248 | 1,236 | (12) | 2,279 | 2,244 | (35) |
| Rig-weighted average | 1,129 | 1,141 | 12 | 6,864 | 6,742 | (122) |
| Drilled but uncompleted wells (DUC) wells | |||
|---|---|---|---|
| Region | March 2021 | April 2021 | change |
| Anadarko | 856 | 835 | (21) |
| Appalachia | 576 | 566 | (10) |
| Bakken | 673 | 647 | (26) |
| Eagle Ford | 1,080 | 1,057 | (23) |
| Haynesville | 363 | 362 | (1) |
| Niobrara | 497 | 458 | (39) |
| Permian | 3,053 | 2,932 | (121) |
| Total | 7,098 | 6,857 | (241) |
-----
Earlier:
2021, May, 13, 17:50:00
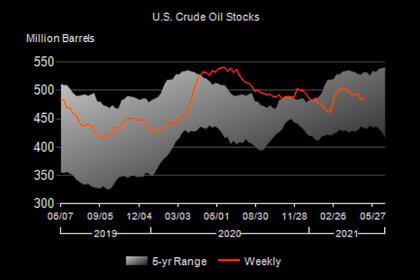
U.S. OIL INVENTORIES DOWN 0.4 MB TO 484.7 MB
U.S. commercial crude oil inventories decreased by 0.4 million barrels from the previous week to 484.7 million barrels,
2021, April, 14, 12:10:00
U.S. OIL PRODUCTION WILL UP
Higher prices are buoying drillers’ confidence. Benchmark Nymex oil gained nearly 35% in the past four months after OPEC and its alliance cut production to strike a balance between demand and supply. The fossil fuel is also getting a bump as Covid-19 vaccinations progress and Americans travel again, boosting gasoline consumption.
2021, April, 12, 10:15:00
U.S. OIL TAX BREAKS $35 BLN
Removing this specific tax measure could generate US$13bn over 10 years. Overall, eliminating fossil fuel subsidies could increase government receipts by US$35bn over 10 years.
2021, March, 29, 13:00:00
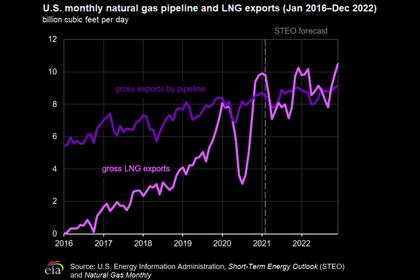
U.S. LNG EXPORTS UP
Between 2015 and 2020, U.S. gas production grew roughly twice as fast (4.3% per year on average) as consumption (2.3% per year), according to data from the U.S. Energy Information Administration.
2021, March, 10, 12:20:00
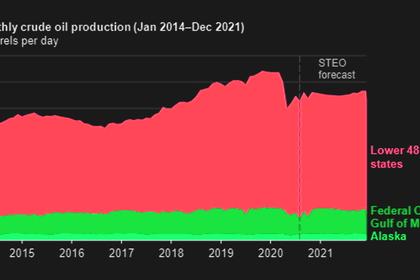
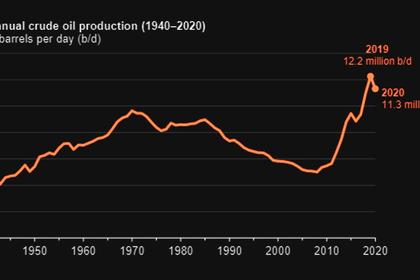
U.S. OIL PRODUCTION DOWN 8%
U.S. crude oil production averaged 11.3 million barrels per day (b/d) in 2020, down 935,000 b/d (8%) from the record annual average high of 12.2 million b/d in 2019.


