2021-06-16 11:15:00


THE NEW U.S. RENEWABLES 94%
By KEN BOSSONG Executive Director SUN DAY Campaign
ENERGYCENTRAL - Jun 7, 2021 - According to a review by the SUN DAY Campaign of data recently released by the Federal Energy Regulatory Commission (FERC), wind and solar resources provided nearly all (93.84%) of the new electrical generating capacity added in the U.S. during the first four months of 2021 .
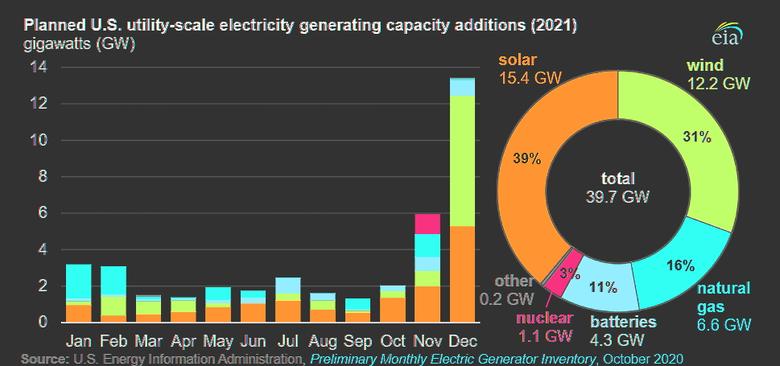
FERC's latest monthly "Energy Infrastructure Update" report (with data through April 30, 2021) reveals that 18 "units" of new wind (3,802-MW) and 131 units of new utility-scale solar (2,702-MW) accounted for most of the capacity added during the first third of this year. Natural gas provided 402-MW, hydropower added 14-MW, oil provided 6-MW, and biomass added 5-MW. All but 1-MW of the new utility-scale capacity reported for the month of April was from wind (659-MW) and solar (147-MW).
Utility-scale renewable energy facilities collectively now account for 24.77% of the nation’s total available installed generating capacity [1] and continue to expand their lead over coal (19.28%), nuclear power (8.21%), and oil (3.14%). The generating capacity of just wind is now more than a tenth (10.24%) of the nation's total while wind and solar combined account for 14.96% … and that does not include distributed (e.g., rooftop) solar. [2]
Further, a review of FERC data over the past five years confirms the rapid growth in the share of the nation's electrical generating capacity played by renewable energy (RE), driven primarily by the expansion of wind plus solar (W+S):
April 2017: RE - 19.57% (W+S - 9.38%)
April 2018: RE - 20.66% (W+S - 10.45%)
April 2019: RE - 21.56% (W+S - 11.48%)
April 2020: RE - 22.87% (W+S - 12.87%)
April 2021: RE - 24.77% (W+S - 14.96%)
In fact, FERC data suggest that renewables’ share of generating capacity is on track to increase even more over the next three years (i.e., by April 2024). “High probability” generation capacity additions for wind, minus anticipated retirements, reflect a projected net increase of 21,889-MW while solar is foreseen growing by substantially more - 41,238MW. Hydropower and biomass are also projected to experience growth (901-MW and 37-MW respectively), while geothermal may dip by 2-MW.
On the other hand, the generating capacities of coal and oil are projected to plummet - by 25,171-MW and 3,354-MW respectively. In fact, FERC reports no new coal capacity in the pipeline over the next three years and just 16-MW of new oil-based capacity. Nuclear power is likewise forecast to drop sharply - by 3,256-MW, or more than 3% of its currently operating capacity.
Moreover, natural gas' currently dominant share of total generating is forecast to diminish as the gap between the growth in new renewable capacity and new gas capacity continues to accelerate. For example, two years ago, FERC forecast the net increase in natural gas capacity to be 18,530-MW during the ensuing three years while renewables would grow by 40,993-MW (i.e., a gap of 22,463-MW). A year ago, FERC's 3-year forecast was for 20,657-MW of net new gas capacity and 53,050-MW from renewables (i.e., a gap of 32,393-MW). And now, in its latest 3-year projection, FERC foresees just 17,558-MW of net new gas compared to 64,063-MW of net new renewable energy capacity (i.e., a gap of 46,505-MW).
In fact, the combination of just wind and solar are forecast to provide nearly four times (i.e., a ratio of 3.6:1) more new generating capacity compared to natural gas over the next three years. Utility-scale solar alone will provide more than twice as much net new capacity as natural gas. Further, wind and solar together will be almost a fifth (19.33%) of the nation's installed generating capacity. Including hydropower, biomass, and geothermal, renewable energy generating capacity should account for almost three-tenths of the nation's total available installed generating capacity - increasing to 28.83%.
Meanwhile, if FERC's projections prove accurate, the net new capacity from natural gas, coal, oil, and nuclear power combined will actually drop by 14,223-MW over the next three years. Coal's share of total installed capacity will drop to 16.55% (from 19.28% today), nuclear's to 7.63% (from 8.21%), and oil's to 2.75% (from 3.14%). Natural gas' share will also decline to 44.06%, compared to 44.42% now.
"FERC's forecasts for strong growth by solar and wind over the next few years may actually prove to be quite conservative," noted Ken Bossong, Executive Director of the SUN DAY Campaign. "Strong support from the Biden Administration coupled with further declines in wind & solar costs, stronger state Renewable Portfolio Standards, expanding corporate renewable energy purchases, and public pressure to address worsening climate change are combining to accelerate an already fast-moving train."
# # # # # # # # #
[1] Capacity is not the same as actual generation. Capacity factors for nuclear power and fossil fuels tend to be higher than those for most renewables. For example, in May 2021, the U.S. Energy Information Administration (EIA) reported that renewables accounted for 21.6% of the nation's total electrical generation during the first quarter of this year; that was somewhat less than their latest reported share of installed generating capacity (24.8%). Conversely, coal's share of generating capacity in April 2021 was 19.3% while its share of electrical generation during the first quarter of 2021 was 23.2%.
[2] FERC generally only reports data for utility-scale facilities (i.e., those rated 1-MW or greater) and therefore its data do not reflect the capacity of distributed renewables, notably rooftop solar PV which - according to the U.S. Energy Information Administration (EIA) - accounts for nearly a third (31.2% in first quarter of 2021) of the nation's electrical generation by solar. That would suggest that the total of distributed and utility-scale solar capacity combined may be as much as 50% higher than the solar capacity of 4.7% reported by FERC -- i.e., probably closer to 7%.
Sources:
FERC's 6-page "Energy Infrastructure Update for April 2021" was released on June 4, 2021. It can be found at: https://cms.ferc.gov/media/energy-infrastructure-update-april-2021 . For the information cited in this update, see the tables entitled "New Generation In-Service (New Build and Expansion)," "Total Available Installed Generating Capacity," and "Generation Capacity Additions and Retirements."
FERC's "Energy Infrastructure Update for April 2020" can be found at:
https://www.ferc.gov/sites/default/files/2020-06/apr-energy-infrastructu...
FERC's "Energy Infrastructure Update for April 2019" can be found at:
https://www.ferc.gov/sites/default/files/2020-05/apr-energy-infrastructu...
FERC's "Energy Infrastructure Update for April 2018" can be found at:
https://www.ferc.gov/sites/default/files/2020-05/apr-energy-infrastructu...
FERC's "Energy Infrastructure Update for April 2017" can be found at:
https://www.ferc.gov/sites/default/files/2020-05/apr-energy-infrastructu...
The latest issue of EIA's "Electric Power Monthly" was posted late on May 25, 2021.
For the data cited in this news update, see:
https://www.eia.gov/electricity/monthly/epm_table_grapher.php?t=table_es...
# # # # # # # # #
The SUN DAY Campaign is a non-profit research and educational organization founded in 1992 to support a rapid transition to 100% reliance on sustainable energy technologies as a cost-effective alternative to nuclear power and fossil fuels and as a solution to climate change.
-----
This thought leadership article was originally shared with Energy Central's Clean Power Community Group. The communities are a place where professionals in the power industry can share, learn and connect in a collaborative environment. Join the Clean Power Community today and learn from others who work in the industry.
-----
Earlier:
2021, June, 8, 13:35:00
U.S. TAX BENEFITS FOR CLEAN ENERGY
Tax credit extensions and cash refunds for clean energy are current motions under consideration in the US House of Representatives cabinets.
2021, June, 2, 13:50:00
U.S., FRANCE CLEAN ENERGY
Ensuring that these energy systems are efficient and reliable, integrating larger shares of renewables coupled with nuclear energy, which is a significant part of today’s electricity production in both our countries, will be crucial to accelerate energy transitions
2021, May, 6, 13:25:00
U.S. SOLAR JOBS DOWN 7%
The decline extends a volatile period for solar sector jobs, which have yet to return to a peak reached in 2016 before the U.S. imposed tariffs on foreign-made panels that increased prices.
2021, March, 31, 11:35:00
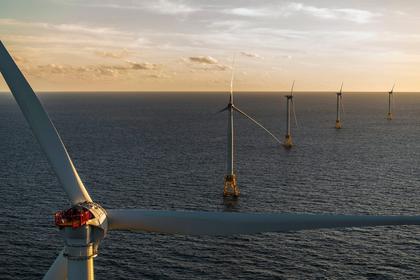
U.S. OFFSHORE WIND 30 GW
As part of the new initiative which spans multiple government agencies, the Departments of the Interior, Energy and Commerce committed to a shared goal of generating 30 gigawatts of offshore wind in the US by 2030.
2021, March, 26, 12:00:00
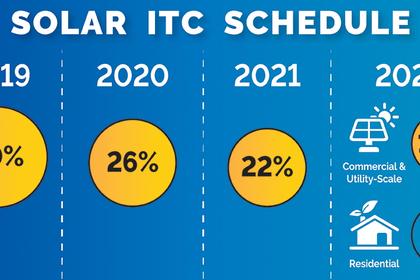
U.S. SOLAR COSTS WILL DOWN
The cost of generating power from the sun has dropped more than 80% in the last decade, making it competitive with plants powered by fossil fuels like coal and natural gas.
2021, March, 22, 08:45:00
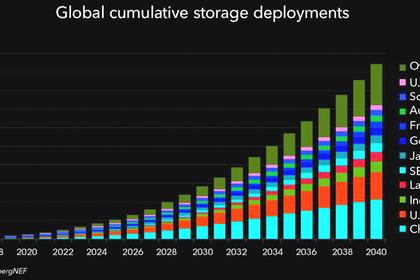
U.S. ENERGY STORAGE MARKET UP
In the last three months of 2020, 2.2 gigawatt-hours (GWh) of energy storage systems were put into operation, according to the energy data firm Wood Mackenzie. That’s an increase of 182% from the previous record-setting quarter.
2021, March, 19, 12:45:00
U.S. ZERO EMISSIONS RISKS
Modelling Princeton conducted on the path to a net-zero future showed not much, if any, increase in gas-fired generation capacity starting now, with small increases in some areas to manage reliability needs from rapid coal retirements offset by retirements of older gas plants in other areas.


