2021-06-16 11:00:00


U.S. SOLAR POWER OVER 100 GW
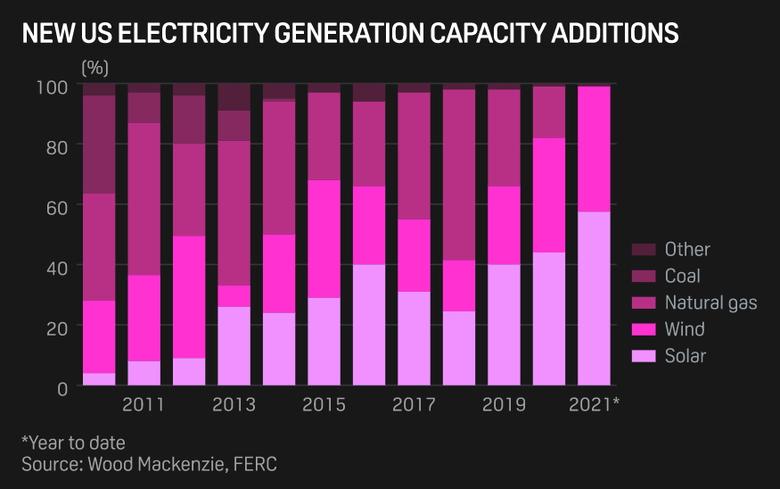
PLATTS - 15 Jun 2021 - The US solar market surpassed 100 GW of installed electric generating capacity in Q1 to account for 58% of all new electric capacity additions in the US, according to a report released June 15 by the Solar Energy Industries Association and Wood Mackenzie.
Renewable energy accounted for nearly 100% of all new electric capacity in Q1 with solar doubling in the last 3.5 years, according to the report.
"It's incredible to see the solar industry pass 100 gigawatts after the policy and regulatory hurdles we've faced over the last few years," Abigail Ross Hopper, president and CEO of SEIA, said in the June 15 statement. "While we're poised for more growth, we must accelerate solar and storage deployment to address the climate crisis and reach President Biden's ambitious clean energy goals. Long-term policy certainty is the best way to do that, and we're urging Congress to act this summer."
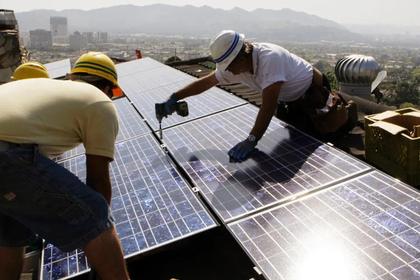
The US solar industry installed 5 GW of new capacity in Q1, a new Q1 record and a 46% increase from Q1 2020, according to the report. The utility-scale sector accounts for a majority of Q1 installations, with a Q1 record of 3.6 GW, as Texas made up the largest share of this capacity, with more than 1.4 GW. Residential solar sales added 905 MW, an 11% increase on the year.
"The first quarter of the year typically brings a slowdown in installations after the year-end push," according to the report. "While Q1 2021 followed this same pattern, all market segments except community solar grew compared with Q1 2020."
A total of 6.2 GW of new utility-scale solar power purchase agreements were announced in Q1 2021, on par with Q1 2020, according to the report. The total utility-scale contracted pipeline has grown to nearly 77 GW.
State level
Texas led all states with 1.525 GW of solar capacity added in Q1, three times more than any other state, according to the report. California, which Texas bumped out of the top spot, added 536 MW, follow by Florida with 525 MW. Indiana, Virginia, Michigan and Iowa were among the top 10 solar states this quarter.
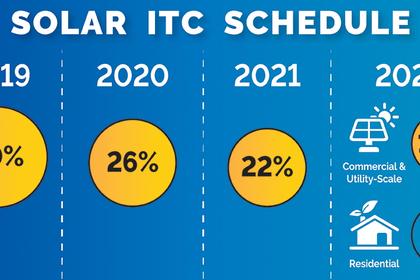
The solar industry will continue to break annual installation records every year for the next three years before the Investment Tax Credit fully phases down under current law, according to forecasts from Wood Mackenzie. Another 160 GW of capacity will be installed between 2021 and 2026 to accompany today's current operational fleet of over 100 GW. This will bring the total operating PV fleet to over 250 GW by the end of 2026.
"Demand for solar power continues to grow, but attention is now turning to supply chain constraints, which have heightened since the latter half of 2020," Michelle Davis, principal analyst and lead author of the report, said in the June 15 statement. "There is a lag between commodity prices and subsequent solar system prices. But there's no doubt this is impacting the solar industry. Installers are managing current equipment shortages and having to decide whether to renegotiate contracts."
Over the last several quarters, critical components for solar equipment – polysilicon, steel, aluminum, semiconductor chips, copper and other metals – have become increasingly supply-constrained, according to the report. Increasing demand for solar, combined with pandemic-related macroeconomic realities, such as increased shipping costs, microchip availability and a residential home renovation boom, have led to increased commodity prices and delivery delays.
-----
Earlier:
2021, June, 8, 13:35:00
U.S. TAX BENEFITS FOR CLEAN ENERGY
Tax credit extensions and cash refunds for clean energy are current motions under consideration in the US House of Representatives cabinets.
2021, May, 31, 13:35:00
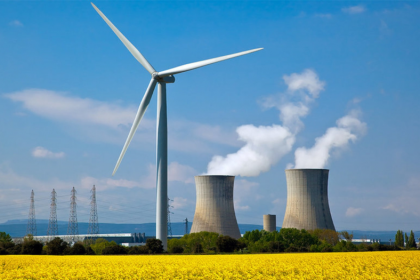
WIND, SOLAR VS NUCLEAR
Overall, nuclear energy is riskier and has a worse environmental impact than wind energy, while wind is enormously less costly.
2021, May, 6, 13:25:00
U.S. SOLAR JOBS DOWN 7%
The decline extends a volatile period for solar sector jobs, which have yet to return to a peak reached in 2016 before the U.S. imposed tariffs on foreign-made panels that increased prices.
2021, April, 14, 11:55:00
U.S. ENERGY INVESTMENT PROMOTION
President Biden recently introduced a massive infrastructure bill designed to reshape the U.S. economy while addressing infrastructure reform. Biden’s stated goal is to achieve 100 percent carbon-free power by 2035.
2021, March, 31, 11:35:00
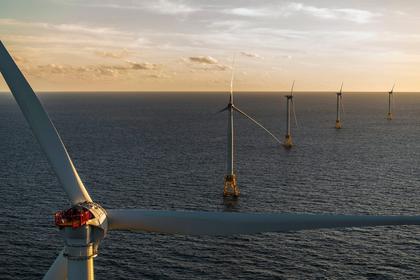
U.S. OFFSHORE WIND 30 GW
As part of the new initiative which spans multiple government agencies, the Departments of the Interior, Energy and Commerce committed to a shared goal of generating 30 gigawatts of offshore wind in the US by 2030.
2021, March, 26, 12:00:00
U.S. SOLAR COSTS WILL DOWN
The cost of generating power from the sun has dropped more than 80% in the last decade, making it competitive with plants powered by fossil fuels like coal and natural gas.
2021, March, 22, 08:45:00
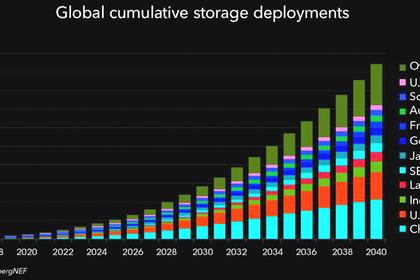
U.S. ENERGY STORAGE MARKET UP
In the last three months of 2020, 2.2 gigawatt-hours (GWh) of energy storage systems were put into operation, according to the energy data firm Wood Mackenzie. That’s an increase of 182% from the previous record-setting quarter.


