2021-07-05 13:00:00


U.S. EMPLOYMENT UP BY 850,000
U.S. BLS - July 2, 2021 - THE EMPLOYMENT SITUATION -- JUNE 2021
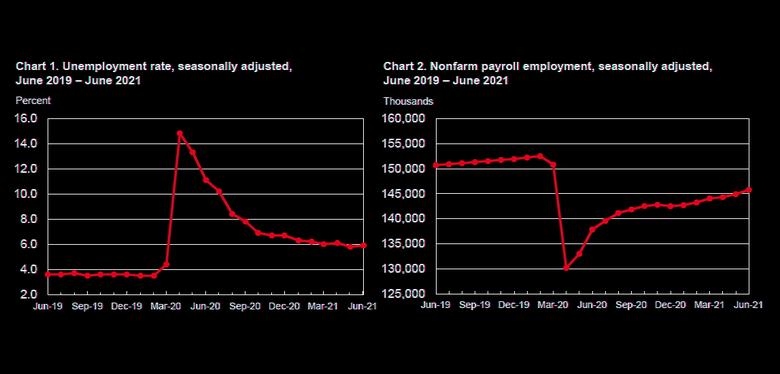
Total nonfarm payroll employment rose by 850,000 in June, and the unemployment rate was little changed at 5.9 percent, the U.S. Bureau of Labor Statistics reported today. Notable job gains occurred in leisure and hospitality, public and private education, professional and business services, retail trade, and other services.
This news release presents statistics from two monthly surveys. The household survey measures labor force status, including unemployment, by demographic characteristics. The establishment survey measures nonfarm employment, hours, and earnings by industry. For more information about the concepts and statistical methodology used in these two surveys, see the Technical Note.
Household Survey Data
Both the unemployment rate, at 5.9 percent, and the number of unemployed persons, at 9.5 million, were little changed in June. These measures are down considerably from their recent highs in April 2020 but remain well above their levels prior to the coronavirus (COVID-19) pandemic (3.5 percent and 5.7 million, respectively, in February 2020). (See table A-1. See the box note at the end of this news release for more information about how the household survey and its measures were affected by the coronavirus pandemic.)
Among the major worker groups, the unemployment rates for adult men (5.9 percent), adult women (5.5 percent), teenagers (9.9 percent), Whites (5.2 percent), Blacks (9.2 percent), Asians (5.8 percent), and Hispanics (7.4 percent) showed little or no change in June. (See tables A-1, A-2, and A-3.)
Among the unemployed, the number of job leavers--that is, unemployed persons who quit or voluntarily left their previous job and began looking for new employment-- increased by 164,000 to 942,000 in June. The number of persons on temporary layoff, at 1.8 million, was essentially unchanged over the month. This measure is down considerably from the high of 18.0 million in April 2020 but is 1.1 million above the February 2020 level. The number of permanent job losers, at 3.2 million, was also essentially unchanged over the month but is 1.9 million higher than in February 2020. (See table A-11.)
In June, the number of long-term unemployed (those jobless for 27 weeks or more) increased by 233,000 to 4.0 million, following a decline of 431,000 in May. This measure is 2.9 million higher than in February 2020. These long-term unemployed accounted for 42.1 percent of the total unemployed in June. The number of persons jobless less than 5 weeks, at 2.0 million, changed little in June. (See table A-12.)
The labor force participation rate was unchanged at 61.6 percent in June and has remained within a narrow range of 61.4 percent to 61.7 percent since June 2020. The participation rate is 1.7 percentage points lower than in February 2020. The employment-population ratio, at 58.0 percent, was also unchanged in June but is up by 0.6 percentage point since December 2020. However, this measure is 3.1 percentage points below its February 2020 level. (See table A-1.)
The number of persons employed part time for economic reasons decreased by 644,000 to 4.6 million in June. This decline reflected a drop in the number of persons whose hours were cut due to slack work or business conditions. The number of persons employed part time for economic reasons is up by 229,000 since February 2020. These individuals, who would have preferred full-time employment, were working part time because their hours had been reduced or they were unable to find full-time jobs. (See table A-8.)
In June, the number of persons not in the labor force who currently want a job was 6.4 million, little changed over the month but up by 1.4 million since February 2020. These individuals were not counted as unemployed because they were not actively looking for work during the last 4 weeks or were unavailable to take a job. (See table A-1.)
Among those not in the labor force who currently want a job, the number of persons marginally attached to the labor force, at 1.8 million, changed little in June but is up by 393,000 since February 2020. These individuals wanted and were available for work and had looked for a job sometime in the prior 12 months but had not looked for work in the 4 weeks preceding the survey. The number of discouraged workers, a subset of the marginally attached who believed that no jobs were available for them, was 617,000 in June, essentially unchanged from the previous month but 216,000 higher than in February 2020. (See Summary table A.)
Household Survey Supplemental Data
In June, 14.4 percent of employed persons teleworked because of the coronavirus pandemic, down from 16.6 percent in the prior month. These data refer to employed persons who teleworked or worked at home for pay at some point in the last 4 weeks specifically because of the pandemic.
In June, 6.2 million persons reported that they had been unable to work because their employer closed or lost business due to the pandemic--that is, they did not work at all or worked fewer hours at some point in the last 4 weeks due to the pandemic. This measure is down from 7.9 million in May. Among those who reported in June that they were unable to work because of pandemic-related closures or lost business, 10.0 percent received at least some pay from their employer for the hours not worked, little changed from the previous month.
Among those not in the labor force in June, 1.6 million persons were prevented from looking for work due to the pandemic. This measure is down from 2.5 million in May. (To be counted as unemployed, by definition, individuals must be either actively looking for work or on temporary layoff.)
These supplemental data come from questions added to the household survey beginning in May 2020 to help gauge the effects of the pandemic on the labor market. The data are not seasonally adjusted. Tables with estimates from the supplemental questions for all months are available online at www.bls.gov/cps/effects-of-the-coronavirus-covid-19-pandemic.htm.
Establishment Survey Data
Total nonfarm payroll employment rose by 850,000 in June, following increases of 583,000 in May and 269,000 in April. In June, nonfarm payroll employment is up by 15.6 million since April 2020 but is down by 6.8 million, or 4.4 percent, from its pre-pandemic level in February 2020. Notable job gains in June occurred in leisure and hospitality, public and private education, professional and business services, retail trade, and other services. (See table B-1. See the box note at the end of this news release for more information about how the establishment survey and its measures were affected by the coronavirus pandemic.)
In June, employment in leisure and hospitality increased by 343,000, as pandemic- related restrictions continued to ease in some parts of the country. Over half of the job gain was in food services and drinking places (+194,000). Employment also continued to increase in accommodation (+75,000) and in arts, entertainment, and recreation (+74,000). Employment in leisure and hospitality is down by 2.2 million, or 12.9 percent, from its level in February 2020.
In June, employment rose by 155,000 in local government education, by 75,000 in state government education, and by 39,000 in private education. In both public and private education, staffing fluctuations due to the pandemic, in part reflecting the return to in-person learning and other school-related activities, have distorted the normal seasonal buildup and layoff patterns, likely contributing to the job gains in June. (Without the typical seasonal employment increases earlier, there were fewer layoffs at the end of the school year, resulting in job gains after seasonal adjustment.) These variations make it more challenging to discern the current employment trends in these industries. Since February 2020, employment is down by 414,000 in local government education, by 168,000 in state government education, and by 255,000 in private education.
Employment in professional and business services rose by 72,000 in June but is down by 633,000 since February 2020. In June, employment rose in temporary help services (+33,000), advertising and related services (+8,000), scientific research and development services (+7,000), and legal services (+6,000).
Retail trade added 67,000 jobs in June, but employment is down by 303,000, or 1.9 percent, since February 2020. Over the month, job growth in clothing and clothing accessories stores (+28,000), general merchandise stores (+25,000), miscellaneous store retailers (+13,000), and automobile dealers (+8,000) was partially offset by losses in food and beverage stores (-13,000) and health and personal care stores (-7,000).
The other services industry added 56,000 jobs in June, with gains in personal and laundry services (+29,000), in membership associations and organizations (+18,000), and in repair and maintenance (+9,000). Employment in other services is 297,000 lower than in February 2020.
Employment in social assistance rose by 32,000 in June, largely in child day care services (+25,000). Employment in social assistance is down by 236,000 from its level in February 2020.
In June, wholesale trade added 21,000 jobs, with gains in both the durable and nondurable goods components (+14,000 and +9,000, respectively). Employment in wholesale trade is 192,000 lower than in February 2020.
Employment in mining rose by 10,000 in June, reflecting a gain in support activities for mining. Mining employment is down by 110,000 since a peak in January 2019.
Employment in manufacturing changed little in June (+15,000). Within the industry, job gains in furniture and related products (+9,000), fabricated metal products (+6,000), and primary metals (+3,000) were partially offset by a loss in motor vehicles and parts (-12,000). Employment in manufacturing is down by 481,000 from its level in February 2020.
Employment in transportation and warehousing was little changed in June (+11,000). Employment gains in warehousing and storage (+14,000), air transportation (+8,000), and truck transportation (+6,000) were partially offset by a loss in couriers and messengers (-24,000). Since February 2020, employment in transportation and warehousing is down by 94,000.
Construction employment changed little in June (-7,000). Over-the-month job losses in nonresidential specialty trade contractors (-15,000) and heavy and civil engineering construction (-11,000) were partially offset by a gain in residential specialty trade contractors (+13,000). Employment in construction is 238,000 lower than in February 2020.
In June, employment showed little change in other major industries, including information, financial activities, and health care. Average hourly earnings for all employees on private nonfarm payrolls rose by 10 cents to $30.40 in June, following increases in May and April (+13 cents and +20 cents, respectively). Average hourly earnings of private-sector production and nonsupervisory employees rose by 10 cents to $25.68 in June. The data for recent months suggest that the rising demand for labor associated with the recovery from the pandemic may have put upward pressure on wages. However, because average hourly earnings vary widely across industries, the large employment fluctuations since February 2020 complicate the analysis of recent trends in average hourly earnings. (See tables B-3 and B-8.)
In June, the average workweek for all employees on private nonfarm payrolls decreased by 0.1 hour to 34.7 hours. In manufacturing, the average workweek fell by 0.2 hour to 40.2 hours, and overtime declined by 0.1 hour to 3.2 hours. The average workweek for production and nonsupervisory employees on private nonfarm payrolls declined by 0.2 hour to 34.1 hours. (See tables B-2 and B-7.)
The change in total nonfarm payroll employment for April was revised down by 9,000, from +278,000 to +269,000, and the change for May was revised up by 24,000, from +559,000 to +583,000. With these revisions, employment in April and May combined is 15,000 higher than previously reported. (Monthly revisions result from additional reports received from businesses and government agencies since the last published estimates and from the recalculation of seasonal factors.)
-----
Earlier:
2021, June, 17, 12:20:00
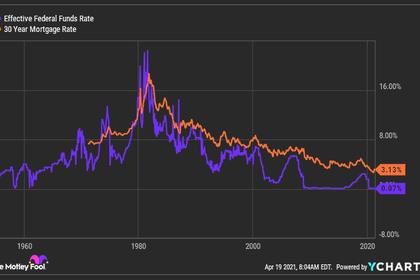
U.S. FEDERAL FUNDS RATE 0.0 - 0.25% YET
The Committee decided to keep the target range for the federal funds rate at 0 to 1/4 percent
2021, June, 8, 13:35:00
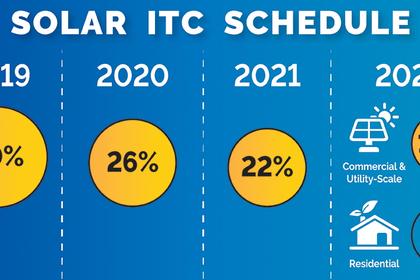
U.S. TAX BENEFITS FOR CLEAN ENERGY
Tax credit extensions and cash refunds for clean energy are current motions under consideration in the US House of Representatives cabinets.
2021, May, 19, 14:25:00
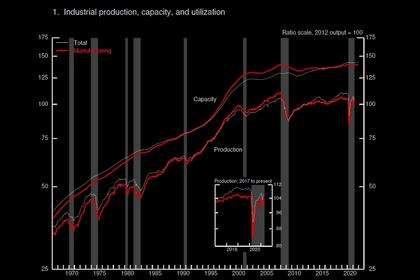
U.S. INDUSTRIAL PRODUCTION UP 0.7%
Total industrial production increased 0.7 percent in April. The indexes for mining and utilities increased 0.7 percent and 2.6 percent, respectively; the index for manufacturing rose 0.4 percent despite a drop in motor vehicle assemblies that principally resulted from shortages of semiconductors.
2021, May, 13, 17:20:00
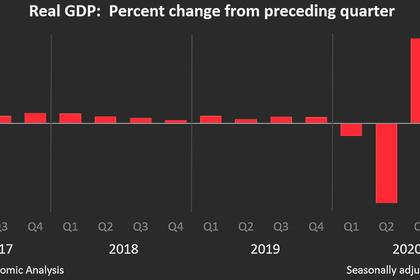
U.S. GDP UP 6.4%
Real gross domestic product (GDP) increased at an annual rate of 6.4 percent in the first quarter of 2021
2021, May, 13, 17:15:00
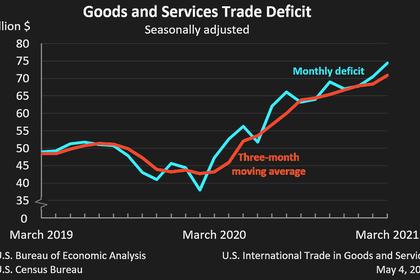
U.S. INTERNATIONAL TRADE DEFICIT UP TO $74.4 BLN
The U.S. goods and services deficit was $74.4 billion in March, up $3.9 billion from $70.5 billion in February
2021, May, 6, 13:25:00
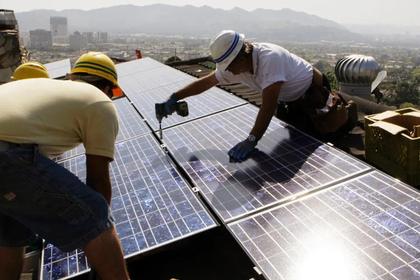
U.S. SOLAR JOBS DOWN 7%
The decline extends a volatile period for solar sector jobs, which have yet to return to a peak reached in 2016 before the U.S. imposed tariffs on foreign-made panels that increased prices.
2021, April, 8, 11:30:00
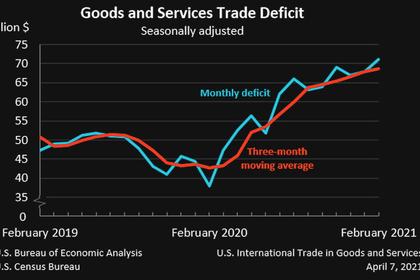
U.S. INTERNATIONAL TRADE DEFICIT UP TO $71.1 BLN
The U.S. Census Bureau and the U.S. Bureau of Economic Analysis announced today that the goods and services deficit was $71.1 billion in February, up $3.3 billion from $67.8 billion in January, revised.


