2021-07-28 10:50:00


U.S. LNG EXPORTS RECORD
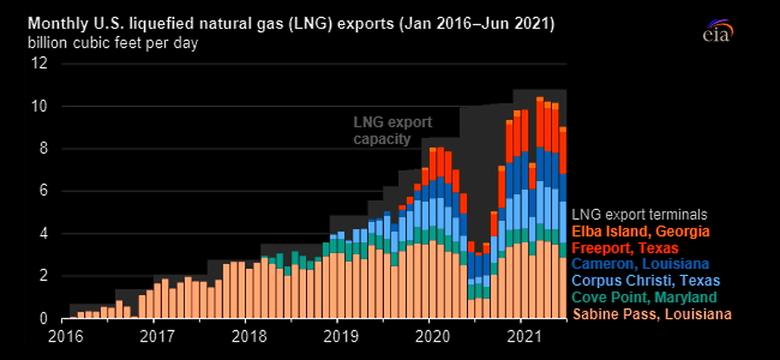
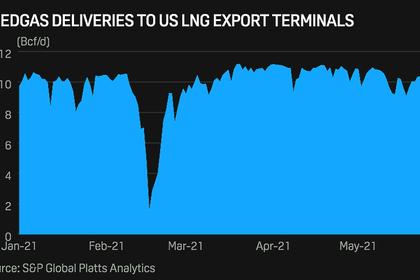
U.S. EIA - JULY 27, 2021 - U.S. exports of liquefied natural gas (LNG) continued to grow in the first six months of 2021, averaging 9.6 billion cubic feet per day (Bcf/d). This average marks an increase of 42%, or 2.8 Bcf/d, compared with the same period in 2020 (according to the U.S. Department of Energy’s LNG Monthly reports and our estimates for June 2021, based on shipping data from Bloomberg Finance L.P.). During the summer months of 2020, U.S. LNG exports fell to record lows, but they set consecutive record highs in November and December.
U.S. LNG exports increased in the first half of this year as international natural gas and LNG spot prices increased in Asia and Europe due to cold weather. Rising global LNG demand once COVID-19 restrictions began to ease, as well as continuous unplanned outages at LNG export facilities in several countries (including Australia, Malaysia, Nigeria, Algeria, Norway, and Trinidad and Tobago), also contributed to increased U.S. LNG exports.
In Asia, colder-than-normal winter temperatures led to increased demand for spot LNG imports. Natural gas demand in the spring continued to rise amid low post-winter inventories, which contributed to unseasonably high natural gas prices. The high prices prompted a higher demand for more flexible LNG supplies, particularly from the United States.
In Europe, natural gas storage inventories were also low following a cold winter. Increasingly hot temperatures in May and June and greater natural gas demand from the electric power sector contributed to high natural gas spot prices. Europe’s natural gas spot prices have historically been lower than prices in Asia; however, this year, Europe’s natural gas prices are tracking Asia's spot LNG prices more closely to attract flexible LNG supplies from around the world to refill storage inventories.

The U.S. Henry Hub natural gas benchmark and U.S. LNG spot market prices have been lower than prices for international natural gas and spot LNG this year. This price difference has supported record volumes of U.S. LNG exports. U.S. LNG exports also increased because of new export capacity added in 2020. The final liquefaction units were commissioned at Freeport, Cameron, and Corpus Christi LNG, and the remaining small-scale units were placed in service at Elba Island LNG. The new units increased total U.S. LNG export capacity by a combined 2.7 Bcf/d for a total peak capacity of 10.8 Bcf/d.
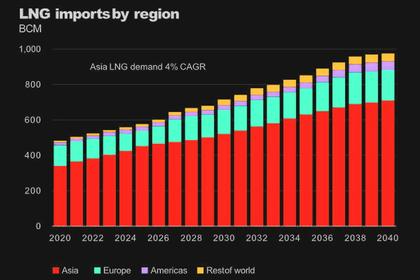
Similar to 2020, Asia remained the top destination for U.S. LNG exports from January through May in 2021, accounting for 46% of the total. Asia was followed by Europe, which had a five-month average share of 37%. Exports to Latin America also increased, particularly to Brazil, which is experiencing its worst drought in more than 90 years.
In June, U.S. LNG exports declined slightly, mainly as a result of maintenance on several pipelines that deliver natural gas to U.S. LNG export facilities. Yet, we expect LNG exports to remain at high levels in the remaining months of this year in our Short-Term Energy Outlook.

-----
Earlier:
2021, July, 9, 12:25:00
ASIA NEED MORE LNG
The spot and long-term LNG pricing dynamics have shifted dramatically from 2020 to 2021, with record lows to record highs recorded in a period of nine months.
2021, July, 8, 12:30:00
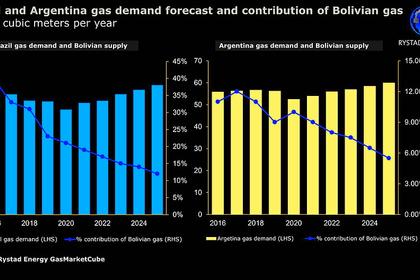
LNG FOR BRAZIL, ARGENTINA
Brazil is responsible for almost half of the imports into South America for the record month, accounting for almost half of the total demand, or 37 Bcf for the month. Imports into Argentina have also been on the rise as domestic gas production and imports from Bolivia have proved insufficient to meet the projected demand for winter in the Southern Hemisphere.
2021, July, 5, 13:25:00
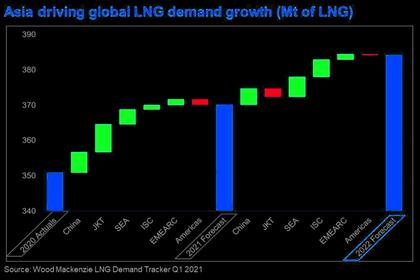
GLOBAL GAS DEMAND UP
“Natural gas demand is set to rebound strongly in 2021 and will keep rising further if governments do not implement strong policies to move the world onto a path towards net-zero emissions by mid-century,” the IEA said in its latest gas outlook.
2021, June, 24, 12:15:00
U.S. LNG DEMAND UP
Wide spreads between the price of LNG in end-user markets in Asia and Europe and feedgas prices based on the US Henry Hub have been incentivizing robust export activity from the US Gulf and Atlantic coasts.
2021, June, 10, 13:00:00
GLOBAL LNG MARKET CHANGES
In Asia, net-zero carbon ambitions will likely require US LNG to arrive in the form of certified low- or carbon-neutral cargoes,
2021, May, 18, 13:00:00
U.S. PRODUCTION: OIL +26 TBD, GAS (-53) MCFD
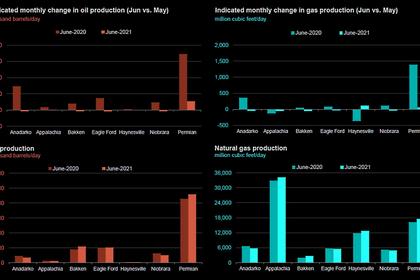
Crude oil production from the major US onshore regions is forecast to increase 26,000 b/d month-over-month in June 2021 from 7,707 to 7,733 thousand barrels/day, gas production to decrease 53 million cubic feet/day from 83,624 to 83,571 million cubic feet/day .
2021, May, 5, 16:15:00
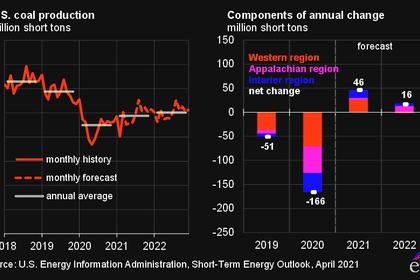
U.S. COAL EXPORTS UP
March coal exports were up 2.5% from 6.71 million mt in February and 9.7% higher than the year-ago month. It was the highest in a month since 7.01 million mt in September 2019.


