2021-09-13 12:20:00


U.S. COAL ELECTRICITY UP 34.7%
By KENT KNUTSON Energy Market Specialist Hitachi ABB Power Grids
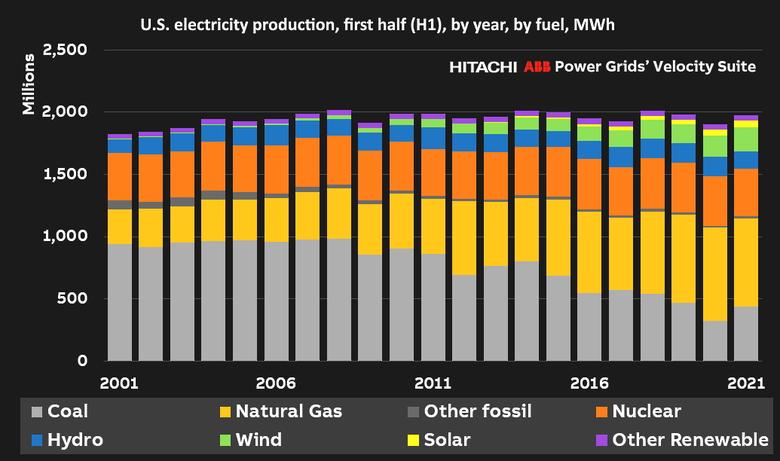
ENERGYCENTRAL - Sep 7, 2021 - Electricity production from wind and solar rose 13.7% (30.1 million MWh) through the first half of 2021 (H1) compared with the same six-month period in 2020. The modest gains in wind and solar were offset by declines in hydro (down 12.6%) and nuclear (down 2.8%) – resulting in a decline from the two resources of 30.9 million MWh.
By far the largest gain in electricity production came from coal power plants across the U.S. – up an astounding 34.7% (112.5 million MWh) while natural gas declined by 5.1% (37.8 million MWh). During 2021/H1 coal and gas contributed 58.2% of all power production across the country – that is up slightly from 2020/H1 (56.5%), but down from 59.7% in 2019/H1. As recently as 2008/H1, coal and gas provided nearly 70% of U.S. electricity production.
Key questions and answers from the 2021/H1 numbers:
How much did electric sales to ultimate customers rebound in 2021/H1? Electricity sales increased by 4.7% – roughly the same percentage that sales were down in 2020/H1 from 2019/H1.
What has been the trend for electricity rates? The average price of electricity increased by 4.5% (to 10.93 c/kWh) with the highest increase in the industrial (up 8.0%) and commercial (up 5.9%) sectors, and the least in the residential (up 2.6%) sector.
How did overall electricity production change over the past year? Though down slightly from the same six-month period in 2019, electricity production in 2021/H1 increased by 3.9% (73 million MWh) from 2020/H1. The relatively large increase in generation was driven most by the economic rebound from the pandemic.
What fuels increased electricity production year-on-year?
- Coal – up 34.7% (112.5 million MWh)
- Wind – up 10% (17.4)
- Solar – up 29% (12.6)
What fuels decreased electricity production year-on-year?
- Natural Gas – down 5.5% (-37.8 million MWh)
- Hydro – down 12.6% (-19.8)
- Nuclear – down 2.8% (-11.1)
What percentage of the total U.S. electricity production did each resource provide during 2021/H1 compared to the same period in 2020/H1?
- Natural gas – 36.1% (down from 39.5% in 2020)
- Coal – 22.2% (up from 17.1%)
- Nuclear – 19.5% (down from 20.8%)
- Wind – 9.7% (up from 9.2%)
- Hydro – 7.0% (down from 8.3%)
- Solar – 2.9% (up from 2.3%)
- The rest – 2.6% (down from 2.8%)
How much capacity is currently under construction or testing that is expected online during the second half (H2) of 2021?
- Solar – 11.8 GW (6.1 GW was added during H1)
- Wind – 10.4 GW (7.2 GW)
- Natural Gas – 4.4 GW (2.0 GW)
How much capacity is scheduled for retirement during the second half (H2) of 2021?
- Nuclear – 4.6 GW (1.1 GW was retired during H1)
- Coal – 3.2 GW (4.1 GW)
- Natural Gas – 1.2 GW (0.6 GW)
Natural gas prices on the rise
The average price of natural gas delivered to power plants during the month of June 2021 was $3.45/MMBtu – that’s up 72% from June of 2020 when delivered gas averaged only $2.01/MMBtu. Historically when gas prices rise utilities opt to burn more coal. Volume receipts for coal deliveries during 2021/H1 were up 22.3% (+104 TBTU) from 2020/H1, while natural gas, despite the significant price hike, was able to still grow by 3.4% (+32 TBTU).
, and average cost ($/MMBtu)")
Gas prices are not expected to decline anytime soon. Gas futures are elevated compared to recent years. The higher gas prices will make coal attractive as a lower-cost dispatchable resource. This is especially true during high load events like winter cold waves and summer heatwaves. Coal and natural gas played a significant role during the historic February cold spell that struck the central part of the country and have been big contributors to the fuel mix this summer during heat waves across the country. Variable resources like wind and solar have been growing rapidly but when the wind is calm and the sun is not shining, dispatchable resources provide a large portion of the electric demand.
Capacity additions and retirements
Already in 2021, there have been 13.3 GW of wind (7.2) and solar (6.1) capacity that has come online, with an additional 22.6 GW of wind (10.4 GW) and solar (11.8 GW) currently under construction or testing and expected online in the second half of 2021. Combine those numbers with more than 9.0 GW of retiring nuclear (4.6 GW), coal (3.2 GW), and natural gas (1.2 GW) power plants and we could see substantial growth in renewable energy output during the second half of the year – this according to project development data compiled by the Hitachi ABB Power Grids’ Velocity Suite research team. Along with the expected growth in renewables, 9.0 GW in nuclear, coal, and gas capacity are scheduled for retirement in the remainder of 2021, and 5.8 GW have already shuttered in the first half of the year.
With more and more wind and solar set to come online, the building of new short and long-duration energy storage is crucial to keep the grid reliable and resilient. The addition of high-voltage transmission lines that interconnect major markets is another investment that will enable more renewables. Meanwhile, until wind and solar energy can be more readily stored, and major power lines are built connecting regions, count on natural gas and coal to generate electricity when needed.
Higher power demand, higher rates, and increased electricity production highlighted the 2021/H1 data – an almost total rebound from the 2020/H1 pandemic year to 2019/H1 levels. Wind and solar electricity production increased significantly, but with rising natural gas prices and increased demand for dispatchable energy during extreme weather events, coal recorded the largest increase in production. Driven by a wave of wind, solar, and battery storage facilities expected online in the second half of 2021, renewables should realize significant gains as the year unwinds.
-----
This thought leadership article was originally shared with Energy Central's Generation Professionals Group. The communities are a place where professionals in the power industry can share, learn and connect in a collaborative environment. Join the Generation Professionals Community today and learn from others who work in the industry.
-----
Earlier:
2021, August, 5, 14:50:00
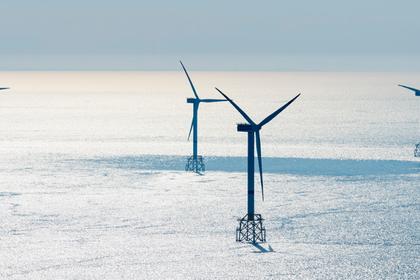
U.S. WIND ENERGY UP
The United States plans to deploy 30 GW of offshore wind in the country by 2030.
2021, July, 28, 11:00:00
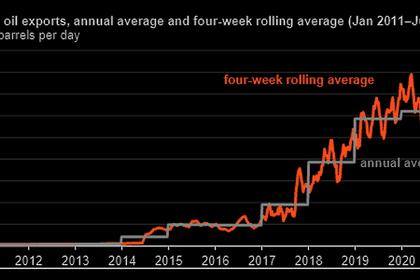
U.S. OIL EXPORTS UP
Despite volatility in global oil markets, U.S. crude oil exports reached a record high in 2020.
2021, July, 28, 10:50:00
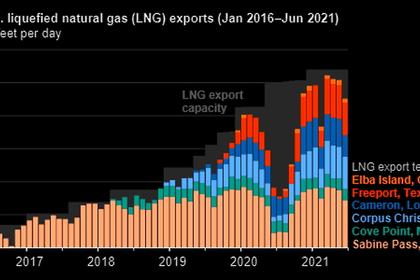
U.S. LNG EXPORTS RECORD
U.S. LNG exports increased in the first half of this year as international natural gas and LNG spot prices increased in Asia and Europe due to cold weather.
2021, July, 27, 10:45:00
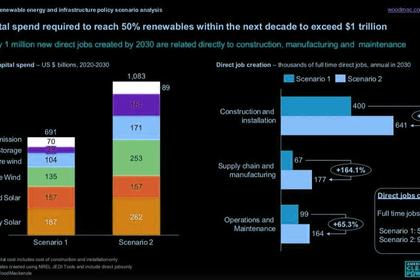
U.S. RENEWABLES 50%
Reaching 50% renewables by the end of this decade would still remain well short of President Biden's call for 80% clean power by 2030 (assuming "clean" means "renewable" and does not include nuclear power or fossil fuels with carbon capture).
2021, June, 25, 12:20:00
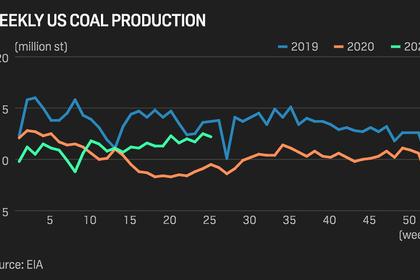
U.S. COAL PRODUCTION UPDOWN
Through 24 weeks, US output was approximately 279 million st, up 8.9% compared with the year-ago period. It is annualized to be 581 million st for the year, up 8.7% from the previous year.

2021, June, 18, 12:20:00
U.S. CLEAN NUCLEAR TRANSITION
This is the only way, she said, that the USA will meet its targets of a 52% reduction in CO2 emissions by the end of 2030, 100% clean energy by 2035 and a net-zero economy by 2050.
2021, June, 8, 13:35:00
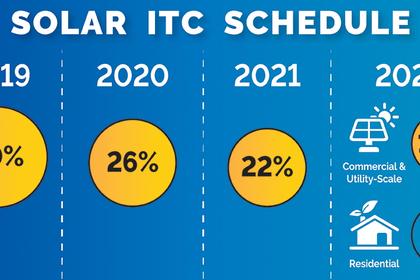
U.S. TAX BENEFITS FOR CLEAN ENERGY
Tax credit extensions and cash refunds for clean energy are current motions under consideration in the US House of Representatives cabinets.


