2021-09-14 12:40:00


WORLD OIL DEMAND GROWTH 6 MBD
OPEC - 13 SEPTEMBER 2021 - OPEC MONTHLY OIL MARKET REPORT
Oil Market Highlights
Crude Oil Price Movements
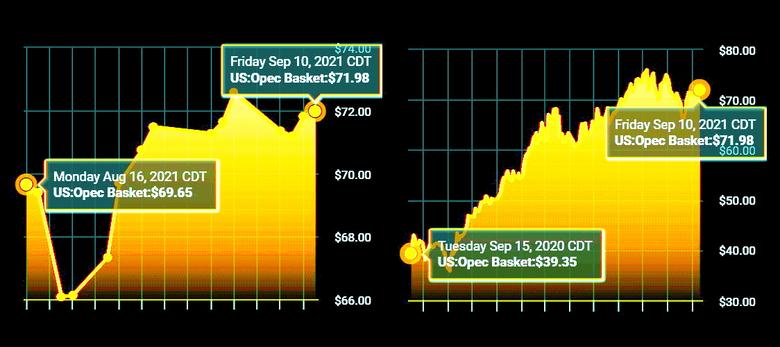
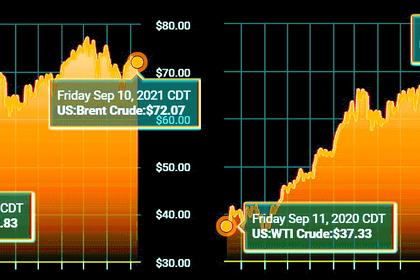
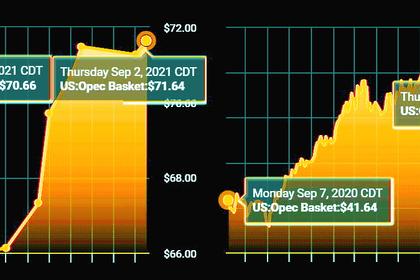
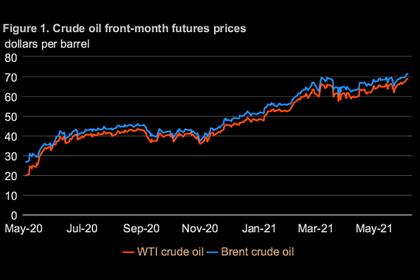
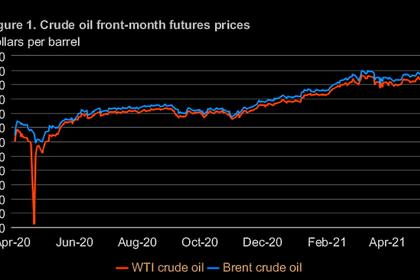
The OPEC Reference Basket (ORB) averaged $70.33/b in August, representing a decline of $3.20 m-o-m, or 4.4%. Year-to-date (y-t-d), ORB was $25.42, or 62.8%, higher, averaging $65.93/b. Crude oil futures prices on both sides of the Atlantic moved sharply lower in August, reaching their lowest levels since last May, as concerns about short-term Asian oil demand, mixed economic data, and the prospect of higher global oil supply triggered a sell-off. In August, the ICE Brent front-month declined $3.78 m-o-m, or 5.1%, to average $70.51/b, and NYMEX WTI fell $4.72 m-o-m, or 6.5%, to average $67.71/b. Consequently, the Brent/WTI front-month futures spread widened in August by 94¢ to average $2.80/b, its strongest since May. The market structure of all three major crude benchmarks – ICE Brent, NYMEX WTI, and DME Oman – remained in backwardation, however, their respective forward curves flattened on uncertainty about the oil demand outlook, lower seasonal crude demand in Asia, and the prospect of rising global oil supply. In August, hedge funds and other money managers extended the previous month's sell-off, reducing their net long positions to the lowest since November 2020.
World Economy
Global economic growth forecasts for both 2021 and 2022 remain unchanged from the last month’s assessment at 5.6% and 4.2% respectively. However, this robust growth continues to be challenged by uncertainties such as the spread of COVID-19 variants and pace of vaccine rollouts worldwide, as well as ongoing global supply-chain disruptions. Additionally, sovereign debt levels in many regions, together with inflationary pressures and central bank responses, remain key factors requiring close monitoring. In the current recovery, the US economy forecasts are unchanged at 6.1% for 2021 and 4.1% for 2022. Euro-zone economic growth remains at 4.7% for 2021 and 3.8% for 2022. The forecast for Japan is also unchanged at 2.8% for 2021 and 2.0% in 2022. China’s economy is seen to grow at 8.5% in 2021 and 6% in 2022, in line with the previous month’s assessment. Meanwhile, India’s 2021 growth forecast is revised slightly down to 9%, following a weaker-than-expected recovery in 2Q21, although growth for 2022 remains unchanged at 6.8%. Given strong growth in 2Q21, Brazil’s growth forecast for this year is revised up to 4.7%, while grow in 2022 is unchanged at 2.5%. Russia’s forecast for 2021 is revised up to 3.5%, benefitting from the stabilised oil market, while the forecast for 2022 remains unchanged at 2.5%.
World Oil Demand
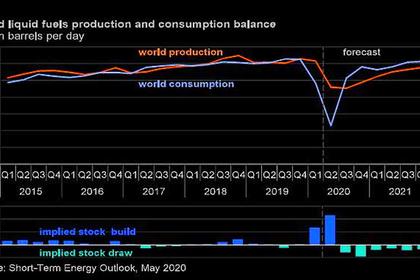
World oil demand growth in 2021 remains unchanged from last month’s assessment, showing growth of 6.0 mb/d despite some offsetting revisions. Oil demand in 3Q21 has proved to be resilient, supported by rising mobility and travelling activities, particularly in the OECD. At the same time, the increased risk of COVID-19 cases primarily fuelled by the Delta variant is clouding oil demand prospects going into the final quarter of the year, resulting in downward adjustments to 4Q21 estimates. As a result, 2H21 oil demand has been adjusted slightly lower, partially delaying the oil demand recovery into 1H22. Global oil demand in 2021 is now estimated to average 96.7 mb/d. In 2022, oil demand is expected to robustly grow by around 4.2 mb/d, some 0.9 mb/d higher compared to last month’s assessment. Revisions were driven by both the OECD and non-OECD, as the recovery in various fuels is expected to be stronger than anticipated and further supported by a steady economic outlook in all regions. Oil demand in 2022 is now projected to reach 100.8 mb/d, exceeding pre-pandemic levels.
World Oil Supply
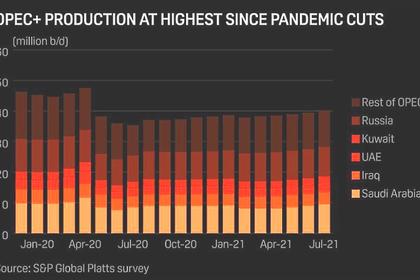
Non-OPEC liquids supply growth in 2021 is revised down by 0.17 mb/d from the previous month’s assessment, due to a downward adjustment of 0.5 mb/d in 3Q21. The revisions are mainly due to outages in North America from a fire on a Mexico’s offshore platform and the disruptions caused by Hurricane Ida. The estimate for North Sea production has also been revised down due to lower-than-expected output in 3Q21, resulting in an annual growth forecast of 0.9 mb/d to average 63.8 mb/d. The main drivers for 2021 supply growth remain to be Canada, Russia, China, the US, Brazil and Norway, with the US expected to see y-o-y growth of only 0.08 mb/d. The non-OPEC supply growth forecast for 2022 is unchanged at 2.9 mb/d, amid offsetting revisions, to average 66.8 mb/d. The main drivers of liquids supply growth are Russia and the US, followed by Brazil, Norway, Canada, Kazakhstan, Guyana and other countries in the DoC. OPEC NGLs are forecast to grow by 0.1 mb/d in both 2021 and 2022 to average 5.2 mb/d and 5.3 mb/d, respectively. OPEC crude oil production in August increased by 0.15 mb/d m-o-m, to average 26.76 mb/d, according to available secondary sources.
Product Markets and Refining Operations
Global refinery margins continued to trend upwards, supported by the seasonal strength in transportation fuels, amid easing mobility restrictions. In the US, product markets were supported by a reduction in total product inventory levels, while seasonal support pushed gasoline margins to new record highs. In Europe, refining margins benefitted from a positive performance across the barrel, while a contraction in fuel outputs from key traditional fuel suppliers within the region helped strengthen European product markets. Meanwhile, in Asia, weakness from rising regional fuel output levels were overshadowed by the robust performance in the jet fuel-kerosene and fuel oil markets, driven by an improvement in summer-related air travel and cooling requirements. Robust fuel consumption levels in India added to the upturn in regional refining economics.
Tanker Market
The VLCC tanker rates remained at depressed levels in August, weighed down by ample tonnage availability despite increased tanker demand. Suezmax and Aframax rates managed a better performance in intra-Asian routes, as well as the Atlantic basin, particularly from West Africa to the US Gulf. Clean tanker rates showed a healthy improvement East of Suez but slipped in the West. The arrival of Hurricane Ida in the Gulf of Mexico at the end of the month resulted in temporary dislocations, lending some support to dirty Aframax rates, while depressing clean rates in the early days of September as Gulf Coast refineries remain offline.
Crude and Refined Products Trade
Preliminary data shows US crude imports averaged 6.3 mb/d in August, while crude exports recovered to just under 3.0 mb/d. US product imports rose m-o-m to a robust 2.6 mb/d, while product exports averaged 5.3 mb/d in August, as lower demand from Latin America offset higher flows to Asia. Disruptions caused by Hurricane Ida at the end of August will likely impact these crude and product flows in September, as oil installations along the US Gulf Coast seek to restart. China’s crude imports averaged 9.7 mb/d in July, remaining relatively flat since April, although recently released data for August shows crude inflows jumping to 10.5 mb/d now that refiners have a further round of quotas. India’s crude imports continued to fall in July, averaging 3.6 mb/d, but positive expectations remain for a pick-up in August, as state-owned refiners look to increase runs to maximum capacity during 4Q21. Japan’s crude imports averaged 2.1 mb/d in July, as the country’s COVID-19 state of emergency continued to weigh on refinery runs amid uncertainty about product demand.
Commercial Stock Movements
Preliminary data shows total OECD commercial oil stocks up by 10.5 mb m-o-m in July. At 2,912 mb, inventories were 305.9 mb lower than the same month a year ago; 122 mb below the latest five-year average; and 57.2 mb lower than the 2015-2019 average. Within components, crude stocks fell by 5.6 mb m-o-m while product stocks rose by 16.1 mb. At 1,404 mb, crude stocks in the OECD were 106.9 mb below the latest five-year average and 80.0 mb below the 2015-2019 average. Meanwhile, OECD product stocks averaged 1,508 mb, representing a deficit of 15.1 mb compared with latest five-year average, but 22.7 mb above the 2015-2019 average. In terms of days of forward cover, OECD commercial stocks rose 0.1 day m-o-m to stand at 63.7 days in July. This is 11.6 days below the same month last year and 1.2 days below the latest five-year average, but 1.5 days above the 2015-2019 average.
Balance of Supply and Demand
Demand for OPEC crude in 2021 is revised up by 0.3 mb/d from last month’s assessment to stand at 27.7 mb/d, representing an increase of 4.9 mb/d over the previous year. Demand for OPEC crude in 2022 is revised up by 1.1 mb/d to stand at 28.7 mb/d, around 1.1 mb/d higher than in 2021.
-----
Earlier:
2021, September, 10, 12:40:00
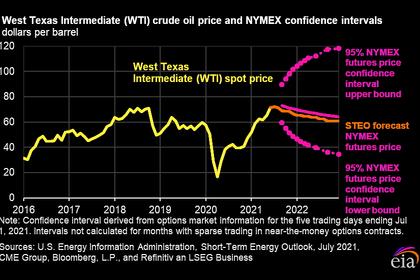
OIL PRICES 2021-22: $71-$66
We expect Brent prices will remain near current levels for the remainder of 2021, averaging $71/b during the fourth quarter of 2021 (4Q21). In 2022, we expect that growth in production from OPEC+, U.S. tight oil, and other non-OPEC countries will outpace slowing growth in global oil consumption and contribute to Brent prices declining to an annual average of $66/b.
2021, September, 6, 12:20:00
OPEC+ OIL ADJUSTMENT 0.4 MBD
Reconfirm the production adjustment plan and the monthly production adjustment mechanism approved at the 19th ONOMM and the decision to adjust upward the monthly overall production by 0.4 mb/d for the month of October 2021.
2021, August, 9, 11:55:00
OPEC+ OIL PRODUCTION UP BY 750 TBD
The 19 countries with quotas under the OPEC+ deal produced 35.99 million b/d in July, despite having a collective ceiling of 36.34 million b/d.
2021, July, 8, 12:45:00
OIL PRICES 2021-22: $72-$67
We expect rising production will reduce the persistent global oil inventory draws that have occurred for much of the past year and keep prices similar to current levels, averaging $72/b during the second half of 2021 (2H21).
2021, June, 9, 12:50:00
OIL PRICES 2021-22: $68-60
EIA forecasts that Brent prices will remain near current levels in 3Q21, averaging $68/b., and $60/b in 2022.
2021, May, 12, 13:00:00
OIL PRICES 2021-22: $65-61
EIA forecasts that Brent prices will average $65/b in the second quarter of 2021, $61/b during the second half of 2021, and $61/b in 2022.
2021, May, 12, 12:55:00
OIL DEMAND WILL UP BY 6.5 MBD
"Under the current OPEC+ production scenario, supplies won't rise fast enough to keep pace with the expected demand recovery," the IEA said. "The widening supply and demand gap paves the way for a further easing of OPEC+ supply cuts or even sharper stock draws."


