2022-01-10 11:15:00


U.S. RENEWABLES +2.5 GW MONTHLY
By KEN BOSSONG Executive Director SUN DAY Campaign
Executive Director of the SUN DAY Campaign since 1992
ENERGYCENTRAL - Jan 4, 2022 - According to a review by the SUN DAY Campaign of data recently released by the Federal Energy Regulatory Commission (FERC) and the U.S. Energy Information Administration (EIA), solar, wind, and other renewable energy sources (i.e., biomass, geothermal, hydropower) are now adding more than 2,250 megawatts (MW) of new generating capacity each month. For perspective, that is more than the planned generating capacity (2,200-MW) of the two reactors at the Vogtle nuclear plant in Georgia that have been under construction since 2013 and for which there is still no certain completion date. [1]
According to the latest issue of FERC's" Energy Infrastructure Update" (with data through October 31, 2021), utility-scale (i.e., >1-MW) renewable facilities added 18,255-MW of new generating capacity during the first ten months of 2021 or an average of 1,826-MW per month. Separately, in its latest "Short-Term Energy Outlook," EIA forecasts that small-scale (i.e., <1-MW), distributed (e.g., rooftop) solar will grow by about 5,100-MW in 2021 - or about 425-MW per month. Thus, utility-scale renewables plus distributed solar are now providing - on average - over 2,250-MW of new capacity each month.
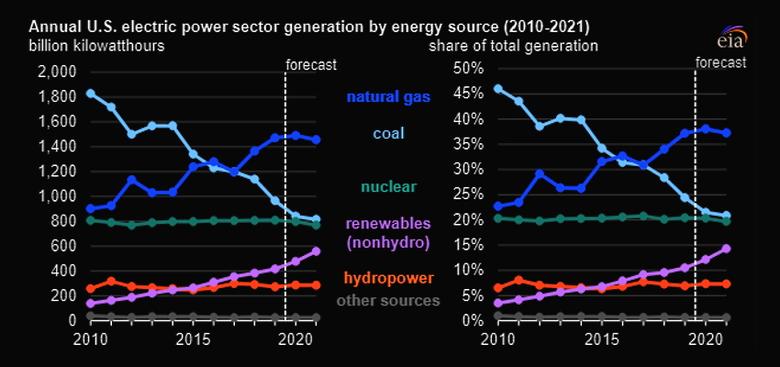
Solar and wind dominated new U.S. electrical generating capacity additions during the first ten months of 2021 adding 9,604-MW and 8,580-MW respectively. Including new hydropower (28-MW), geothermal (25-MW), and biomass (18-MW), renewables provided 83.6% of all new generating capacity through the end of October. New renewable capacity was more than five times greater than that of natural gas (3,549-MW). There was no new nuclear capacity added in 2021 while new oil and coal capacity increased by just 19-MW and 11-MW respectively.
Renewables now provide more than a quarter (25.47%) of total U.S. available installed generating capacity - a share significantly greater than that of coal (18.77%) and more than three times that of nuclear power (8.32%). [2] By comparison, a year ago, renewables' share was only 23.31%. Five years ago, it was 18.58% and a decade earlier it was 14.12%.
That growth is almost entirely attributable to a nearly three-fold increase in wind's share of installed generating capacity and a 35-fold increase in solar's share. Wind is now more than a tenth (10.54%) of the nation's generating capacity (up from 3.80% in October 2011) while utility-scale solar has surpassed five percent (5.21%) - up from 0.15% in October 2011 ... and that does not include small-scale distributed solar. [3]
Moreover, during the first ten months of 2021, solar and wind have each set new records for capacity additions. The 9,604-MW of new solar thus far reported by FERC for the first ten months of 2021 dwarfs the 6,516-MW added during the same time period in 2020 or the 3,758-MW added in 2019. Likewise, the 8,580-MW of new wind capacity significantly exceeds the 7,161-MW reported for 2020 or the 4,721-MW added in 2019.
The increase in solar and wind capacity is manifesting itself in ever-higher levels of electrical generation by those sources. According to the latest issue of EIA's "Electric Power Monthly" report (with data through October 31, 2021), utility-scale solar and wind generation during the first ten month of 2021 increased by 27.9% and 11.1% respectively compared to the same period in 2020. Wind now accounts for 8.64% of U.S. electrical production while solar - including small-scale - is providing 4.08%.
In addition, FERC data suggest that the share of generating capacity from solar and wind is on track to increase significantly over the next three years (i.e., by October 2024). FERC notes that there may be as much as 170,941-MW of new solar capacity in the pipeline with 52,692-MW classified as "high probability additions" offset by only 92-MW of projected "retirements." Just a year ago, FERC reported 128,001-MW of solar in the three-year pipeline with 32,784-MW classified as "high probability." In addition, new wind capacity by October 2024 could total 71,929-MW with 23,180-MW being "high probability" and only 150-MW of retirements expected.
“High probability” generation capacity additions for utility-scale solar and wind combined, minus anticipated retirements, reflect a projected net increase of 75,630-MW, or over 2,100-MW per month. Again, that figure does not include new distributed, small-scale solar capacity or additions by hydropower, geothermal, and biomass. By comparison, net growth for natural gas will be only 14,327-MW. Thus, solar and wind together are forecast to provide more than five times as much new net generating capacity as natural gas over the next three years ... not to mention over 50 times as much net new capacity as nuclear power (just 1,377-MW).
If just FERC's latest "high probability" projections materialize, by October 2024, renewable energy sources should provide over 30 percent (30.13%) of the nation's total available installed generating capacity with utility-scale solar and wind accounting for 9.00% and 11.81% respectively, or more than 20% combined.
"The breath-taking pace at which solar and wind are adding new capacity explains why renewable sources combined have eclipsed the generating capacity of nuclear power and surpassed that of coal as well as whittled down the lead of natural gas," noted Ken Bossong, Executive Director of the SUN DAY Campaign. "Conservatively, over the next three years, renewables should expand from about a quarter of the nation's generating capacity today to at least thirty percent and probably more."
Earlier:
2021, December, 27, 11:35:00
U.S. CLEAN ENERGY INVESTMENT $1.2 TLN
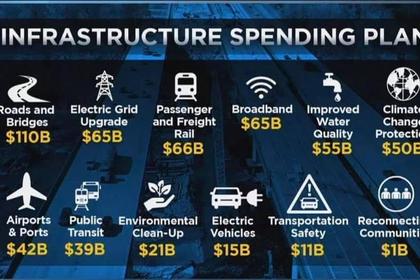
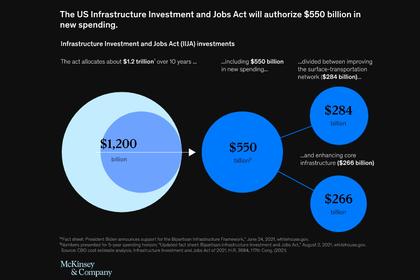
The $1.2 trillion Infrastructure Investment and Jobs Act signed by President Biden last month contains more than $80 billion to advance the clean energy transition and fight climate change.

2021, December, 23, 16:00:00
U.S. WIND PROJECT 2.6 GW
The CVOW project is expected to help Virginia meet the targets of the Virginia Clean Economy Act, which requires the State to have 100% clean energy by 2045. The United States aims to deploy 30 GW of offshore wind by 2030 and to permit at least 25 GW of onshore renewable energy by 2025.

2021, December, 9, 12:05:00
U.S. FUSION INVESTMENT $1.8 BLN
Commonwealth Fusion Systems (CFS) announced on 1 December that it has closed on more than $1.8 billion in Series B funding to commercialise fusion energy. This includes capital to construct, commission, and operate SPARC, the world’s first commercially relevant net energy fusion machine.
2021, December, 6, 12:40:00
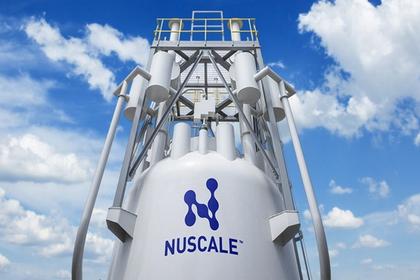
U.S. SMR NUCLEAR
The NuScale Power Module is a pressurised water reactor with all the components for steam generation and heat exchange incorporated into a single unit, generating 77 MWe.
2021, November, 17, 13:15:00
U.S. CLEAN ENERGY LAW
The USD1.2 trillion package is a key part of the president's Build Back Better agenda and contains a total of more than USD62 billion for the US Department of Energy (DOE) to deliver a "more equitable clean energy future", including preventing the premature retirement of existing nuclear plants and investing in advanced nuclear projects.

2021, November, 10, 12:05:00
U.S. ENERGY CLIMATE INVESTMENT $1.2 TLN
The US House of Representatives has passed a US$1,200bn infrastructure bill.
2021, October, 19, 12:20:00
U.S. ECONOMIC, ENERGY PLAN $3.5 TLN
The most immediate goal of the plan is to push the energy sector to reach at least 80% clean energy output by 2030.


