GLOBAL GAS CONSUMPTION WILL UP
GECF - 26 October 2022 - Annual Short Term Gas Market Report
Executive Summary
The global gas industry recovered strongly in 2021 from the negative impacts of the COVID-19 pandemic. However, the pace of recovery across the gas value chain has been unsynchronised and resulted in significant turbulence in the global gas market.
Underinvestment in the gas industry over the past few years and geopolitical tensions have contributed to an imbalance between gas supply and demand in H1 2022. This imbalance has pushed spot gas and LNG prices to record highs accompanied by extreme volatility. Despite the current challenges facing the gas industry, gas has a major role to play in the global energy transition to a low carbon future and for sustainable development.
Global Economy
The global economy rebounded by 6.1% in 2021, driven by easing of COVID-19 restrictions, expansion of fiscal and monetary policies and a recovery in international trade. However, global economic growth is estimated to slow to 3.2% in 2022 due to escalating geopolitical tensions, supply chain disruptions, China’s zero-COVID policy, high energy and commodity prices, rising inflation and tightening financial conditions.
In 2023, global economic growth is expected to slow further to around 2.9%, driven by soaring prices and rising inflation. Meanwhile, global inflation is expected to rise by 8.3% in 2022 after which it eases to 4.8% in 2023.
Energy Policies
The ramifications of the COVID-19 pandemic, geopolitical developments and energy security concerns influenced recent energy policies. Governments implemented financial supporting mechanisms for energy producers and consumers to cope with the negative impact of the pandemic. There has since been a shift in focus to security of supply concerns, following the recovery in energy demand and tightening market conditions in H2 2021. On the supply side, the countries have incentivised domestic gas production while on the demand side, the energy policy developments have mostly focused on enhancing energy security and reducing the burden of high-energy prices on consumers.
Investment in the Oil & Gas Industry
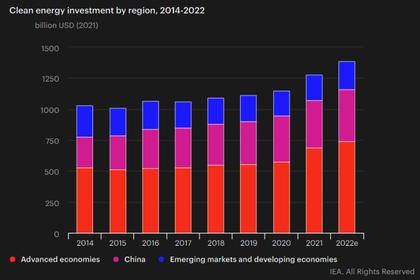
There has been significant underinvestment in the oil and gas industry since 2014, which has contributed to the gas supply concerns and high prices. Global oil and gas investment in 2021 increased by 17% to around $673 billion and is expected to further increase by 7% in 2022 to around $718 billion. This favourable investment climate has driven by energy security concerns, extremely high spot prices and growing gas demand.
However, there are some risks to the investment including rising inflation as well as more investment into low-carbon energies by energy companies.
Gas Consumption
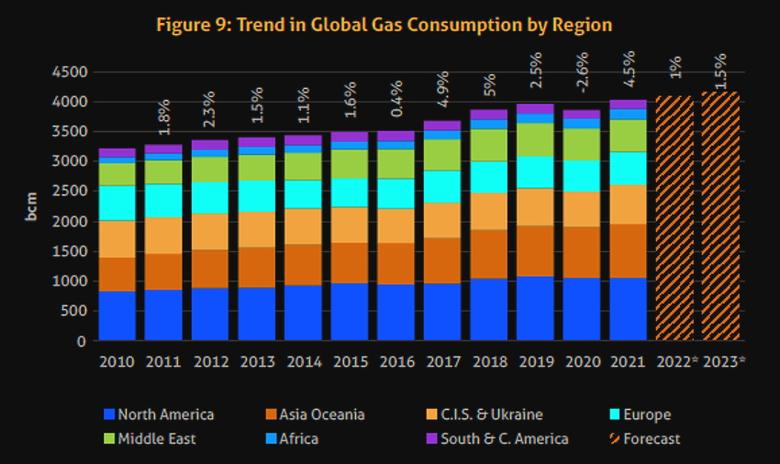
Global gas consumption expanded by 4.5% in 2021 to above the pre-pandemic level. This was supported by recovery in economic growth and industrial activity, as well as abnormal weather conditions. In 2022, global gas consumption is forecasted to rise by up to 1%, driven by the stronger gas burn in the U.S. and coal-to-gas switching in China’s residential sector, which could offset a decline in Europe. Further in 2023, consumption is forecasted to increase by up to 1.1% driven by China, South and South East Asia and the Middle East. Coal and oil switching to gas, infrastructure development and higher industrial activity will boost gas consumption.
Gas Production
Global natural gas production rose by 4% in 2021 due to the recovery in gas demand, rebound in associated gas production and the commissioning of new gas fields. At a country level, the increase came mainly from Russia, Algeria, the U.S. and China. For 2022 and 2023, global gas production is forecasted to increase by 1% and 1.5% respectively driven mainly by stronger production from North America, Asia and Middle East. The global gas rig count continues to recover in 2022, which is expected to support the higher gas production. However, increasing costs and geopolitical tensions are downside risks.
Pipeline Natural Gas Trade
Global net pipeline gas trade increased by 8% in 2021, to reach 568 bcm. The overall increase was supported by the recovery in global gas consumption. This rise in pipeline imports was driven largely by the European region, which accounted for 61% of the global market share. Meanwhile, GECF Member Countries together accounted for 75% of global net pipeline gas exports in 2021. In 2022 and going forward, it is anticipated that global pipeline gas trade will decrease, as the EU reduces its reliance on Russian pipeline gas. This has already been observed in H1 2022.
LNG Trade
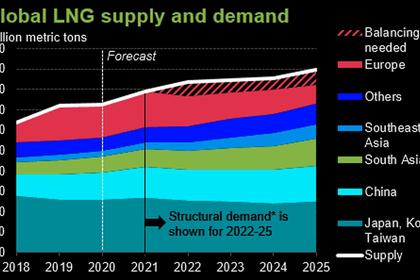
In 2021, global LNG imports expanded by 6% to 378 million tonnes driven by stronger gas demand in China, Brazil and South Korea. Since Q4 2021, there has been a shift in LNG flows away from Asia to Europe due to tight spot LNG price spreads between both markets. In 2022 and 2023, global LNG exports are forecasted to expand by 4-5% and 6-7% respectively, driven by higher LNG exports from GECF and non-GECF countries.
The stronger LNG exports is supported by the start-up of new liquefaction projects, improvement in feedgas availability and lower maintenance.
LNG Infrastructure
2020, with Qatar accounting for more than 60%. The development of new LNG liquefaction projects continued apace in 2022, with 30 Mtpa of capacity reaching FID between January and September mainly from the U.S. High gas and LNG prices and strong LNG contracting for new projects supported the FID on new projects. Between October 2022 and December 2023, almost 160 Mtpa of new liquefaction capacity are targeting FID, mostly in the U.S.
LNG Shipping Cost
LNG spot charter rates for steam-powered carriers experienced extreme highs at the start and towards the end of 2021. On average, charter rates in 2021 reached $66,000 per day, which was an increase of 50% over the average level of the previous year. The average price for leading shipping fuel oil also increased from 2020 to 2021, by 78%, to reach $514 per tonne. Consequently, these two factors combined to have the effect of a doubling of spot LNG shipping costs from 2020 to 2021. In 2022, charter rates returned to more historically-experienced levels, while robust price growth in the oil market continued to drive prices in shipping fuels.
Gas Storage
Underground natural gas storage in the EU in 2021 was greatly influenced by the high gas prices at the time. As a consequence, replenishment of gas stocks was muted, and the storage levels during H2 2021 were the lowest observed in the previous five years.
In 2022, the gas crisis in the region forced policymakers to impose gas storage filling regulations. These measures ensured that despite gas prices in the region reaching record highs, underground storage sites across the continent were filled to at least 80% in preparation for the upcoming winter.
Energy Prices
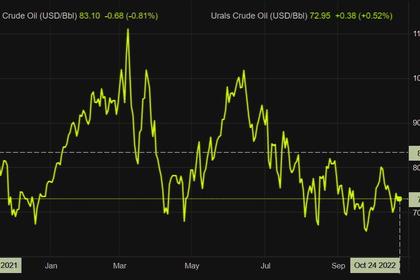
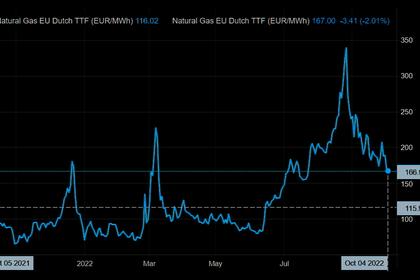
Gas and LNG spot prices in 2021 were characterized by historic highs, with TTF hub and Asian LNG prices skyrocketing. This was driven by extreme weather and strong global economic recovery, higher gas demand, while constraints at several LNG facilities invoked limits on the supply side. In H1 2022, spot prices continued to surge, driven by escalating geopolitical tensions, tight LNG market, higher gas demand, low EU gas storage and gas supply concerns. Furthermore, spot prices have recorded extreme volatility, with TTF reaching an all-time high above $96/MMBtu in August 2022.
GECF Annual Ststistical bulletin 2022 PDF version
-----
Earlier:
