RUS | ENG | All
Enter the email or login, that you used for registration.
If you do not remember your password, simply leave this field blank and you will receive a new, along with a link to activate.

Not registered yet?
Welcome!

2022-03-14 11:35:00

THE NEW U.S. RENEWABLES 81%

THE NEW U.S. RENEWABLES 81%


By KEN BOSSONG Executive Director SUN DAY Campaign

Executive Director of the SUN DAY Campaign since 1992

ENERGYCENTRAL - Mar 10, 2022 -  According to a review by the SUN DAY Campaign of data newly released by the Federal Energy Regulatory Commission (FERC) and the U.S. Energy Information Administration (EIA), solar, wind, and other renewable energy sources (i.e., biomass, geothermal, hydropower) provided 81.07% of new domestic electrical generating capacity in 2021.

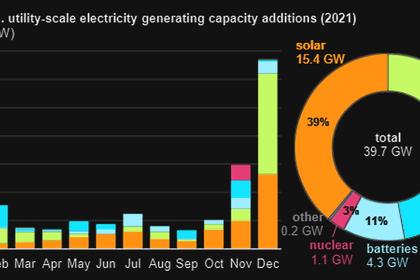
According to the latest issue of FERC's" Energy Infrastructure Update" (with data through December 31, 2021), utility-scale (i.e., >1-MW)  renewable facilities added 23,639 megawatts (MW) of new generating capacity last year with solar and wind providing 12,804-MW and 10,754-MW respectively. Small additions were also provided by hydropower (28-MW), biomass (28-MW), and geothermal (25-MW). These numbers are preliminary and, based on the pattern of past years, are likely to grow in subsequent reporting.[1]

Separately, in its latest "Short-Term Energy Outlook," EIA reports that the U.S. electric power sector added 14,000-MW of new wind capacity and 13,000-MW of utility-scale solar capacity in 2021. EIA also notes that small-scale (i.e., <1-MW), distributed (e.g., rooftop) solar grew by about 5,100-MW last year.

Thus, utility-scale renewables plus distributed solar provided - on average - roughly 2,400-MW or more of new generating capacity each month in 2021. For perspective, that is more than the planned generating capacity (2,200-MW) of the two reactors at the Vogtle nuclear plant in Georgia that have been under construction since 2013 and for which there is still no certain completion date. [2] 

Even FERC's more modest numbers indicate that new renewable capacity in 2021was more than four times greater than that of natural gas (5,489-MW). There was no new nuclear capacity added in 2021 while new oil and coal capacity increased by just 19-MW and 11-MW respectively.

Renewables now provide more than a quarter (25.81%) of total U.S. available installed generating capacity - a share significantly greater than that of coal (18.49%) and more than three times that of nuclear power (8.29%). [3] By comparison, a year ago, renewables' share was only 24.06%. Five years ago, it was 19.17% and a decade earlier it was 14.26%.

That growth is almost entirely attributable to a nearly three-fold increase in wind's share of installed generating capacity and a 32-fold increase in solar's share over the past ten years. Wind is now more than a tenth (10.68%) of the nation's generating capacity (up from 3.93% in December 2011) while utility-scale solar has surpassed five percent (5.44%) - up from 0.17% in December 2011 ... and that does not include small-scale distributed solar. [4]

In addition, FERC data suggest that the share of generating capacity from solar and wind is on track to increase significantly over the next three years (i.e., by December 2024). FERC notes that there may be as much as 180,875-MW of new solar capacity in the pipeline with 53,812-MW classified as "high probability" additions and no offsetting "retirements." The "high probability" additions alone would nearly double utility-scale solar's current installed capacity of 67,780-MW while successful completion of all projects in the pipeline would more than triple it.

In addition, new wind capacity by December 2024 could total 76,822-MW with 21,577-MW being "high probability" and only 150-MW of retirements expected. Thus, installed wind capacity could grow by at least 16% and possibly by nearly 60%.

“High probability” generation capacity additions for utility-scale solar and wind combined, minus anticipated retirements, reflect a projected net increase of 75,239-MW over the next three years, or almost 2,100-MW per month. Again, that figure does not include new distributed, small-scale solar capacity or additions by hydropower, geothermal, and biomass. By comparison, net growth for natural gas will be only 11,990-MW. Thus, solar and wind together are forecast to provide more than six times as much new net generating capacity as natural gas by December 2024... not to mention almost 350 times as much net new capacity as nuclear power (projected to add only 218-MW).

If just FERC's latest "high probability" projections materialize, by December 2024, renewable energy sources should provide over 30 percent (30.51%) of the nation's total available installed generating capacity with utility-scale solar and wind accounting for 9.34% and 11.86% respectively, or more than one-fifth (21.28%) combined.

Meanwhile, over the next three years, coal's share of total installed generating capacity will drop by 27,579-MW reducing its share from 18.49% to 15.57%; that of gas will fall from 44.16% to 43.15%; and nuclear power's contribution will decline from 8.29% to 7.95%.

"FERC's and EIA's 2021 data once again confirm that the transition away from fossil fuels and nuclear power is well underway, led by the breath-taking growth of solar and wind," noted Ken Bossong, Executive Director of the SUN DAY Campaign. "Given those agencies' habit of low-balling renewable energy growth, even their strong forecasts for renewable energy over the next few years are likely to be surpassed."

# # # # # # # # #

Notes: 

[1] Data reported by FERC in its monthly "Energy Infrastructure Update" are often preliminary and updated in subsequent reports. In particular, renewable energy capacity additions tend to be revised upwards. For example, in its December 2020 "Update," FERC reported 22,451-MW of renewable energy additions in 2020. A year later, it had revised that figure to 27,750-MW.

[2] For a general history of the Vogtle nuclear plant and the construction schedule for units 3 and 4, see: https://en.wikipedia.org/wiki/Vogtle_Electric_Generating_Plant

[3] Capacity is not the same as actual generation. Capacity factors for nuclear power and fossil fuels tend to be higher than those for most renewables. Thus, in its most recent "Electric Power Monthly" report, EIA reported that renewables accounted for 21.02% of the nation's total electrical generation in 2021 - that is, somewhat less than what FERC reported was their share (25.81%) of installed generating capacity for the same period.

[4] FERC generally only reports data for utility-scale facilities (i.e., those rated 1-MW or greater) and therefore its data do not reflect the capacity of distributed renewables, notably rooftop solar PV which - according to the EIA - accounts for about 30% of the nation's electrical generation by solar. That would suggest that the total of distributed and utility-scale solar capacity combined is significantly more than the solar capacity of 5.44% reported by FERC for 2021and is perhaps closer to7.5%.

Sources:

FERC's 6-page "Energy Infrastructure Update for December 2021" was released on March 8, 2022 and can be found at: https://cms.ferc.gov/media/energy-infrastructure-update-december-2021. For the information cited in this update, see the tables entitled "New Generation In-Service (New Build and Expansion)," "Total Available Installed Generating Capacity," and "Generation Capacity Additions and Retirements." FERC notes that its data are derived from Velocity Suite, ABB Inc. and The C Three Group LLC. and adds the caveat that "the data may be subject to update."

FERC's "Energy Infrastructure Update for December 2020" report can be found at: https://cms.ferc.gov/media/energy-infrastructure-update-december-2020  

FERC's "Energy Infrastructure Update for December 2016" report can be found at:

https://www.ferc.gov/sites/default/files/2020-05/dec-energy-infrastructu...

FERC's "Energy Infrastructure Update for December 2011" report can be found at:

https://www.ferc.gov/sites/default/files/2020-05/12-11-energy-infrastruc...

EIA's most recent "Short-Term Energy Outlook" was released on March 8, 2022. For EIA's 2021 data for wind, utility-scale solar, and small-scale solar, see: https://www.eia.gov/outlooks/steo/report/electricity.php

EIA's latest "Electric Power Monthly" report was released on February 25, 2022. For the data cited in this news release, see Table ES1.B. "Total Electric Power Industry Summary Statistics, Year-to-Date 2021 and 2020" at https://www.eia.gov/electricity/monthly/epm_table_grapher.php?t=table_es1b

-----

This thought leadership article was originally shared with Energy Central's Clean Power Community Group. The communities are a place where professionals in the power industry can share, learn and connect in a collaborative environment. Join the Clean Power Community today and learn from others who work in the industry.

-----


Earlier:

THE NEW U.S. RENEWABLES 81%
2022, March, 9, 13:10:00
U.S. RENEWABLE ELECTRICITY 21%
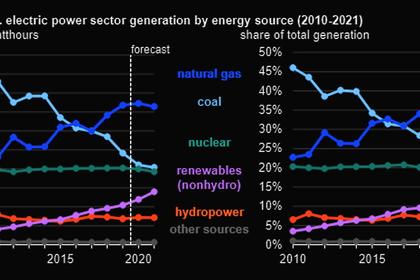
Combined, solar and wind grew by 15.96% and accounted for more than one-eighth (13.05%) of U.S. electrical generation (wind - 9.12%, solar - 3.93%).
THE NEW U.S. RENEWABLES 81%
2022, March, 2, 11:05:00
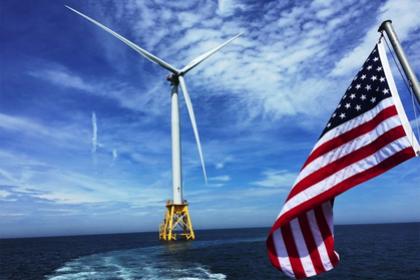
U.S. OFFSHORE WIND 5.6 GW, $4.4 BLN
The United States aims to instal 30 GW of offshore wind by 2030. At the regional level, New York and New Jersey have set the target of installing 16 GW of offshore wind by 2035.
THE NEW U.S. RENEWABLES 81%
2022, February, 28, 13:05:00
U.S. CLEAN ENERGY TRANSITION STRATEGY
The challenges are immense for the United States related to: raw material availability; manufacturing capacity; dependence on foreign supplies; worker training; global trade practices; cybersecurity; and research and data analysis needed to create the clean energy economy we need.
THE NEW U.S. RENEWABLES 81%
2022, January, 13, 13:54:00
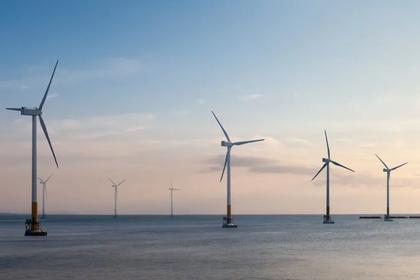
U.S. OFFSHORE WIND 30 GW
The country aims to instal 30 GW of offshore wind by 2030.
THE NEW U.S. RENEWABLES 81%
2022, January, 11, 11:40:00
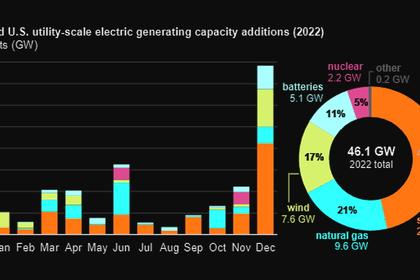
U.S. SOLAR POWER + 46 GW
In 2022, we expect 46.1 gigawatts (GW) of new utility-scale electric generating capacity to be added to the U.S. power grid,
THE NEW U.S. RENEWABLES 81%
2022, January, 10, 11:15:00
U.S. RENEWABLES +2.5 GW MONTHLY
Solar, wind, and other renewable energy sources (i.e., biomass, geothermal, hydropower) are now adding more than 2,250 megawatts (MW) of new generating capacity each month.
THE NEW U.S. RENEWABLES 81%
2021, December, 27, 11:35:00
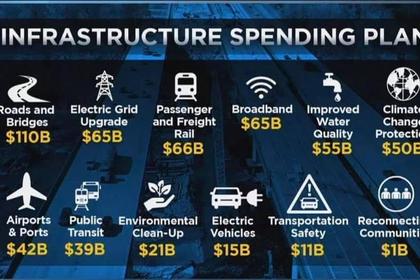
U.S. CLEAN ENERGY INVESTMENT $1.2 TLN
The $1.2 trillion Infrastructure Investment and Jobs Act signed by President Biden last month contains more than $80 billion to advance the clean energy transition and fight climate change.
All Publications »
Tags: USA, RENEWABLE, SOLAR, WIND, HYDRO,