2022-04-11 13:05:00


U.S. HYDROCARBONS WAR
By RON MILLER Principal Reliant Energy
- Governmental actions in the war on hydrocarbons
- Importance of hydrocarbons in the energy mix
- Horizontal fracking value in reducing electricity costs
- Natural gas impact on CO2 emission reduction
- Misguided petroleum import decisions
- Punishing “Big Oil” hurts everyday Americans
- Run up in refined products pricing
Actions against U.S. hydrocarbon development:
The Administration has made many decisions regarding America’s energy future that will negatively impact both our energy security and the energy price for the future including:
- Issued Secretarial Order No. 3395, which implemented a 60-day suspension of new oil and gas leasing and drilling permits for federal land and water.
- Cancelled the Keystone XL Pipeline in January 2021
- Directed federal agencies to eliminate subsidies for fossil fuels
- Eliminated natural resource damages payments, restoration and reimbursement of government costs as being tax deductible
- Reversed the Trump Administration’s rollback on methane regulations
- Staffed the SEC in preparation to mandate ESG and climate disclosures
- Eliminated intangible drilling costs deduction
- Reduced the percentage depletion tax break, which allows independent producers to recover development costs of declining oil and gas reserves
- Encouraged financial institutions to disfavor oil and gas investments, thus starving the industry of much-needed development capital for energy production
- Revisited a new Windfall Profits Tax
Governmental actions made now will have a profound future effect on the ability of the oil and gas industry to produce the needed energy required for our economy and existence.
Importance of hydrocarbons in the energy mix
Hydrocarbons are immensely important to our current and future existence as we are not at the stage to move 100% to economically-viable, reliable, and always-available renewable energy.
Graph 1 indicates natural gas’ contribution to electricity supply which is almost 3 times that of solar, wind, and geothermal combined. In addition to baseload gas plants, natural gas offers peaking production of electricity to fill the gaps left by intermittent solar and variable wind energy generation.
Notice the vertical red dotted line for 2008, signifying the change in natural gas production in the U.S. due to horizontal fracking, and attendant downward direction of coal as a power generation fuel with an upward direction of natural gas.

Horizontal fracking value in reducing electricity costs
From 1990 to 2008, U.S. retail electricity prices increased from 6.57 cents/kWh to 9.74 cents/kWh, or an average annual inflation rate of 2.21%. Conversely, since the advent of horizontal drilling/fracking for natural gas in 2008, U.S. retail electricity prices increased from 9.74 cents/kWh in 2008 to 10.66 cents/kWh in 2020, or an average annual inflation rate of 0.82%.
Consequently, the annual electricity inflation rate from 2008-2020 is a fraction (37%) of the electricity inflation rate from 1990-2008, or stated another way, since fracking started in 2008, the U.S. retail electricity price annual increases declined by 63% benefitting U.S. electricity consumers. Reviewing Graph 2, we see a marked change in the annual retail electricity price inflation rate, starting to plateau in 2008 due to the fracking for natural gas.

Source: https://www.statista.com/statistics/183700/us-average-retail-electricity-price-since-1990/
Without the advent of fracking, and the lowering of the annual electricity price inflation rate, the U.S. consumer would have paid a total of $479.11 billion more in electricity costs from 2008-2020. Are we truly ready to eliminate hydrocarbons from our future energy diet?
Coupled with increased, abundant, and relatively-cheap natural gas, the fracking revolution changed the economics for coal-fired vs. gas-fired electricity generation as shown in Graph 3 beginning in 2008.

As the natural gas supply increased in 2008 due to fracking, the price volatility of natural gas dampened, thus providing more economic incentive to make the long-term transition/investment from coal to gas. Without this incentive, America would be using more coal-fired electricity vs. the cleaner-burning natural gas and not reducing CO2 emissions.
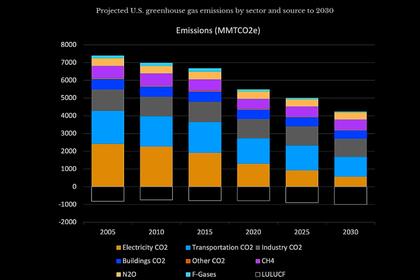
Natural gas impact on CO2 emission reduction
Natural gas is a cleaner burning fuel than coal for electricity generation, and since 2008 it has been abundantly-available and priced better than coal, the U.S. was able to reduce its CO2 emissions from 2005-2020 by over 970 million annual metric tons as shown in Graph 4.

Compared with China which has increased its annual CO2 emissions by 4,689 million annual metric tons, the U.S. has led the developed world in lowering emissions.
The importance of U.S. natural gas production and export of liquefied natural gas (LNG) is further underscored by Toby Rice, CEO of EQT, in his statement:
“Using U.S. LNG to replace global coal plants with gas by 2030 would equate to electrifying 100% of U.S. vehicles, rooftop solar on every U.S. home, and doubling U.S. wind capacity”
https://www.eqt.com/responsibility/unleashing-us-lng/
To effectively, efficiently, and economically reduce CO2 emissions, using U.S.-produced LNG to replace coal plants is an integral part of the strategy well before the premature closure of the domestic oil and gas industry.
The impact of shale fracking in the U.S. is simplified by the following:
- Fracking shale gas formations leads to (→) increased natural gas supply
- Increased gas supply → lower gas prices and reduces price volatility
- Lower gas prices / lower volatility → replacing coal with gas for electricity generation
- Lower gas prices → lower/more stable electricity prices
- Lower electricity prices → greater economic growth, increased GDP
- Less coal use for electricity generation → reduced CO2 emissions
Misguided petroleum import decisions
Many Americans were recently surprised at the huge import volumes of crude oil and refined products from Russia as shown in Graph 5, especially in light of their invasion of neighboring Ukraine on 24 Feb 2022.

The Russian crude importation brings up the obvious question: Does America have other options to Russia for its crude requirements?
One obvious alternative is importing heavy Canadian crude via the Keystone XL pipeline to replace like quality crude for American refineries.
A comparison of the two alternatives on both cost in annual dollars and metric tons of CO2 emissions is shown below with the following assumptions:
- Imported 672,000 barrels/day of Russian crude/refined products in 2021
- Distance from Taman, Russia to Houston of ~10,368 kilometers
- Very large crude carrier capacity of ~2 million barrels
- Average speed of ~16.5 knots
- VLCC fuel consumption of ~141,000 liters of diesel per day
- Average global price of diesel fuel is ~1.26 U.S. Dollars per liter
- Roundtrip time of ~32 days, including loading and unloading
Importing Russian hydrocarbons cost the following in 2021:
- 551 million liters of diesel
- $694 million for fuel
- 1.483 million metric tons of CO2 emissions
To replace the same 672,000 barrels per day of Russian shipborne crude with Canadian crude via the Keystone Pipeline, assume the Keystone would use 5.23 million MWh of electricity per year. With the average U.S. cost of $100 per MWh, Keystone would cost $523 million for energy to operate, or about $171 million less than the diesel energy used for shipping Russian crude to Houston.
Assuming that 50% of the electricity for Keystone was gas-fired and the remaining from renewables, the emissions would be 1.39 million metric tons of CO2 per year, compared to 1.483 million tons for Russian crude, or about 930,000 tons per year less.
The decision to cancel the Keystone XL Pipeline did not prevent the same crude from getting to its ultimate market, be it by less-safe and potentially environmentally-damaging truck or railcar disposition. Pipeline transportation of hydrocarbons has been proven to be a more economical and reliable mode than truck, rail, or barge.
(Reference for safe transportation of hydrocarbons, "Which Transportation Mode Is Safer For Liquid Hydrocarbon Transfer In The U.S.?")
https://www.linkedin.com/pulse/which-transportation-mode-safer-liquid-hydrocarbon-us-ron/?published=t)
The Keystone XL pipeline deliveries of Canadian crude would replace the importation of ocean-borne Russian crude. In the current context of a Russian hydrocarbon embargo by the U.S., the U.S. refinery system is lacking the same low quality, high sulfur, low cost crude that the Keystone XL could replace from Canada.
The alternatives to Canada to supply this much-needed crude for America’s refineries are Russia, Saudi Arabia, Iran, or Venezuela. How secure do Americans feel relying on these countries as a key reliable supplier of long-term crude to the U.S. for the future?
Every day that America continues to import ~672,000 barrels of Russian oil, we pay Putin over $63 million to fund his war machine. Referencing the 2008-2020 history, the U.S. has imported over 200 million barrels per year of Russian crude and refined products, at a cost to America of well over $15 billion per year.
Punishing “Big Oil” hurts everyday Americans
The recent comments by Secretary of Energy Jennifer Granholm, Senator Sheldon Whitehouse, and Representative Ro Khanna on a new Windfall Profits Tax (WPT) is also an inhibitor to U.S. production of much-needed hydrocarbons. Their intention of this WPT is obviously geared to punish “Big Oil”, but who really is “Big Oil”?
Contrary to popular belief by some politicians, America's oil companies aren't owned just by a small group of insiders as shown in Chart 1. Only 2.9 percent of industry shares are owned by corporate management. The rest is owned by tens of millions of Americans, many of them middle class.
A strong oil and natural gas industry is a vital part of the retirement security for millions of Americans. State pension fund investments in oil and natural gas companies are providing strong returns for teachers, firefighters, police officers, and other public pension retirees, according to a Sonecon study.
https://whoownsbigoil.com/#/?section=whoowns-the-oil-companies-2

By punishing “Big Oil” with the WPT bill would punish millions of Americans who depend upon the dividends from these companies, while discouraging oil and gas production.
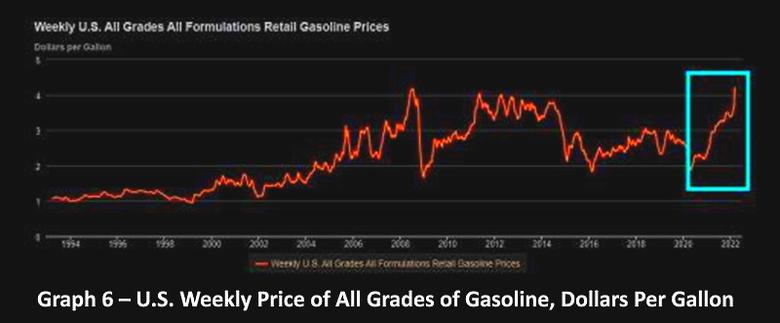
Recent run up in refined products pricing
With the recent high inflation in America (over 7.9% annual increase, the highest inflation rate in 41 years), everyday Americans are recognizing a painful reality at the gas pump. Source: https://www.usinflationcalculator.com/inflation/current-inflation-rates/
To put this in perspective, the crude price in January 2021 per the Energy Information Administration (EIA) was $56.64/bbl.; the price in February 2022 was $95.72. That's a 69% increase in crude price well before the Russian invasion of Ukraine.
Of the 93.33% price jump from January 2021 price of $56.64/bbl. to the current $109.50/bbl., 73.93% of the price jump occurred before the war started on 24 February 2022, and 26.07% of the price jump occurred after the start of the war.
Graph 6 illustrates the large and rapid increase in gasoline prices in America in the recent 15 months that are representative of policies detrimental to a vibrant and efficient oil and gas industry

Source: https://www.eia.gov/dnav/pet/hist/LeafHandler.ashx?n=PET&s=EMM_EPM0U_PTE_NUS_DPG&f=W
Key Takeaways
- America is not in a position to currently divorce itself from oil & gas
- A viable renewable energy backstop to oil & gas production does not now exist to guarantee Americans cost-effective, reliable, and 24/7 energy availability
- Constraining oil & gas production by a premature announcement of the end of the oil & gas industry in America, without an accompanying and verifiable reduction in demand follows the time-honored law of supply and demand by increasing the cost of oil and gas to everyday Americans
- Securing reliable and cost-effective long-term crude supply is still a key driver for a vibrant and secure American economy
- Governmental decisions do not always rationally evaluate both the economics and emissions impact, thus allowing sub-optimal and counter-productive energy outcomes that cost Americans more money while increasing emissions
- Electricity, gasoline, crude supply reliability is tied directly to market pricing
- The shale gas revolution has lowered U.S. electricity prices by almost $480 billion from 2008-2020, while facilitating the retirement of coal-fired generation plants and reducing emissions
Summary
- End the vilification of the oil & gas industry to allow it access to much-needed capital for increasing domestic production to meet demand
- Reduce crude imports from unfriendly, less-reliable sources (Russian, Iran, Venezuela), and replace them imports from our biggest trading partner, Canada
- Re-instate the Keystone XL pipeline to provide 672,000 barrels per day of high sulfur, low gravity Canadian crude to allow America’s refineries, which are the most sophisticated of any in the world, to operate more efficiently
-----
Earlier:
2022, April, 5, 13:35:00
U.S. CLIMATE CHANGES $2 TLN
The Office of Management and Budget assessment, tasked by President Joe Biden last May, found the upper range of climate change's hit to the budget by the end of the century could total 7.1% annual revenue loss, equal to $2 trillion a year in today's dollars.
2022, March, 29, 13:05:00
U.S. CARBON FREE ELECTRICITY 2035
The Biden administration has set a goal of a carbon-free electric sector by 2035.

2022, February, 28, 13:05:00
U.S. CLEAN ENERGY TRANSITION STRATEGY
The challenges are immense for the United States related to: raw material availability; manufacturing capacity; dependence on foreign supplies; worker training; global trade practices; cybersecurity; and research and data analysis needed to create the clean energy economy we need.
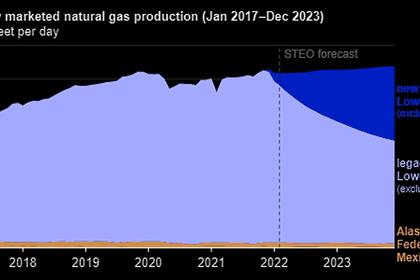
2022, February, 18, 11:15:00
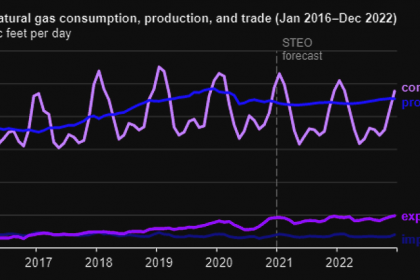
U.S. GAS PRODUCTION WILL RISE
U.S. natural gas marketed production will increase to an average of 104.4 billion cubic feet per day (Bcf/d) in 2022 and then further increase to a record-high 106.6 Bcf/d in 2023
2022, February, 17, 13:50:00
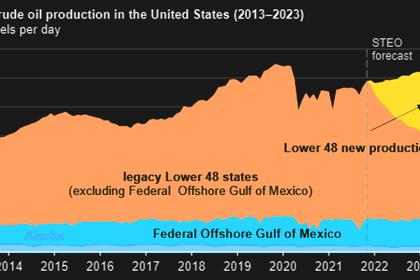
U.S. OIL PRODUCTION WILL RISE
U.S. crude oil production will increase to 12.0 million b/d in 2022, up 760,000 b/d from 2021.

2022, February, 17, 13:45:00
U.S. CLEAN HYDROGEN INVESTMENT $9.5 BLN
“Clean hydrogen is key to cleaning up American manufacturing and slashing emissions from carbon-intensive materials like steel and cement while creating good-paying jobs for American workers,” said U.S. Secretary of Energy Jennifer M. Granholm. “We're seeking feedback from the American public on how to make scaling up this clean, affordable energy source a reality for the United States.”
2022, January, 24, 12:20:00
U.S. ENERGY CRISIS RISK
Years of anti-fossil fuel policymaking have led to a growing portfolio of canceled natural gas pipeline projects, a trend that places US energy supply at risk,


