2022-05-04 12:00:00


GLOBAL RENEWABLES UP TO 85% IN 2021
By ANDREW BLAKERS Professor of Engineering Australian National university
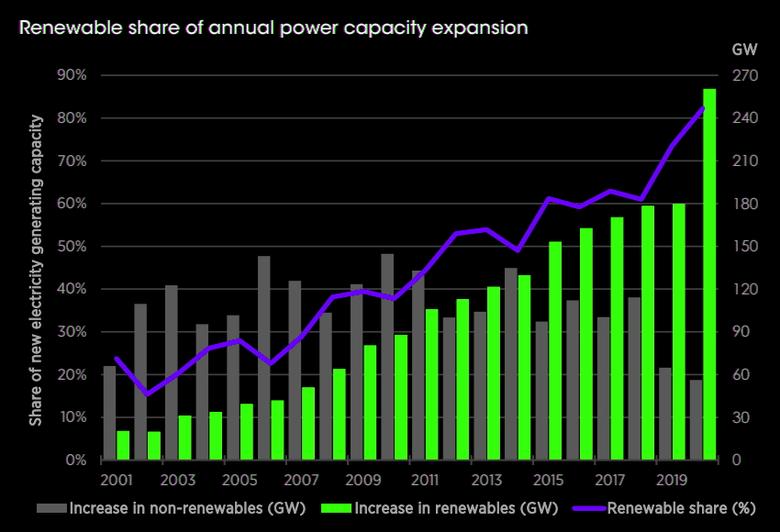
ENERGYCENTRAL - Apr 26, 2022 - In 2021, solar PV and wind comprised about three quarters of global net generation capacity additions. Adding in the other renewables brought the figure to 85%.

Figure 1: global net capacity additions. Data is drawn from the International Renewable Energy Agency, The Australian Clean Energy Regulator, the Global Wind Energy Council, the World Nuclear Association, the Global Energy Monitor and the International Technology Roadmap for PV
ENERGY OPTIONS
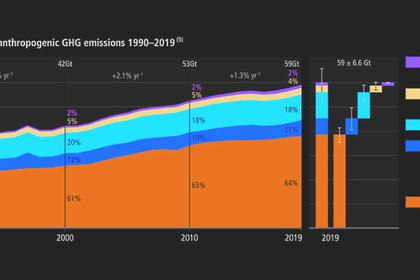
Complete removal of fossil fuels from the global economy removes three quarters of global greenhouse emissions. Electrification of everything (transport, heating and industry) requires doubling or tripling electricity production, depending on the size of the chemical industry in a particular country and the amount of synthetic aviation fuel required.
Land requirements are modest: complete solar electrification of everything (and removal of all fossil fuels) requires about 100 m2 of solar panels per person. These panels can be located on rooftops, in arid areas, in conjunction with agriculture and floating on water bodies.
Solar PV and wind reached 840 and 825 GW respectively. They must do the heavy lifting to mitigate climate change since that are by far the leading clean generation technologies in terms of global annual additions. They have unlimited energy resources in the form of sun and wind. Although there are supply chain bottlenecks from time to time, these are primarily symptoms of rapid growth, and are soon resolved by growth in production of materials or substitution of other materials. About 80 Terawatts of solar & wind is required to decarbonize the globe, which can be achieved by 2050 at current annual growth rates.
Hydro generation capacity reached 1360 GW and new capacity is averaging 20 GW per year. Since the number of rivers available for damming is finite, hydro cannot become a major player in global electricity markets. However, Pumped Hydro Energy Storage has a dominant role to play in balancing variable solar and wind.
According to the World Nuclear Association, over the past decade operational global nuclear capacity rose slightly to 390 GW and global nuclear generation declined slightly to 2.6 TWh. Thus, the nuclear industry is stagnant and is falling behind solar and wind energy generation.
Bio energy is a destructive form of energy generation except when genuine waste is utilized. The poor outlook of bio energy comes down to the miserable efficiency of biological capture of solar energy, in the range 0.1-1%, which is 20-200 times less than the efficiency of solar PV. Bio competes with food production and ecosystems for land, water, pesticides and fertilizers.
Solar thermal, geothermal and ocean energy have largely failed in the global marketplace and make trivial contributions to global generation except in a few places.
RENEWABLE LEADERS
Renewables capacity deployment (new Watts per person in 2021) is shown in Figure 2. Norway, Netherlands, Sweden and Australia are ahead of the pack.

Figure 2: renewables deployment speed per person
Australian is a special case. Australian solar energy is much better than in Europe. Furthermore, Australia is physically isolated from neighboring countries, and cannot share variable solar and wind electricity across national boundaries. Australia is learning to cope with high levels of solar and wind and is finding the task to be much easier than anticipated.
SOUTH AUSTRALIA, GLOBAL LEADER
The state of South Australia (population 1.7 million) is perhaps the globally leading GW-scale solar/wind dominated grid. Its electricity comes mostly from solar & wind (70%) with supplementation from fossil gas and a small fraction (~1%) of net imports/exports. The South Australia grid displays excellent stability and has wholesale spot market electricity prices that are amongst the lowest in Australia.
In the first week of February, South Australia derived 89% of its electricity from solar and wind (Figure 3). The solar/wind fraction regularly exceeds 100% over the course of 24 hours and has reached 136% for a short period. The rooftop solar fraction exceeds 85% at times.

Figure 3: South Australia generation (MW) in the first week of February; solar=yellow, wind=green, gas=orange, imports=purple, blue=battery
South Australia is weakly connected to the other states. Transmission capacity is ~0.9 GW compared with average and peak demand of 1.6 GW and 3.2 GW respectively. South Australia hosts about 0.3 GW of batteries, and this is expected to rapidly increase. Four synchronous condensers have been installed. South Australian solar and wind is expected to average more than 100% by 2025, which coincides with the doubling of transmission capacity to the eastern states.
-----
This thought leadership article was originally shared with Energy Central's Clean Power Community Group. The communities are a place where professionals in the power industry can share, learn and connect in a collaborative environment. Join the Clean Power Community today and learn from others who work in the industry.
-----
Earlier:
2022, April, 26, 14:00:00
GLOBAL RENEWABLE ENERGY MARKET DOWN
A retreat from wind power could have devastating consequences, as it is set to play a pivotal role in global efforts to transition to green energy.
2022, April, 20, 11:20:00
GLOBAL RENEWABLES UP TO 3 064 GW
By the end of 2021, global renewable generation capacity amounted to 3 064 Gigawatt (GW), increasing the stock of renewable power by 9.1 per cent.
2022, April, 13, 12:55:00
GLOBAL OIL DEMAND 2022: +3.7 MBD
For 2022, world oil demand growth is revised down by 0.5 mb/d to stand at 3.7 mb/d, mostly reflecting the downward revision in world economic growth. Oil demand growth is forecast at 1.9 mb/d in the OECD and 1.8 mb/d in the non-OECD.
2022, April, 5, 13:40:00
GLOBAL CLIMATE DISASTER
We are on a pathway to global warming of more than double the 1.5-degree (Celsius, or 2.7-degrees Fahreinheit) limit” that was agreed in Paris in 2015.
2022, April, 5, 13:30:00
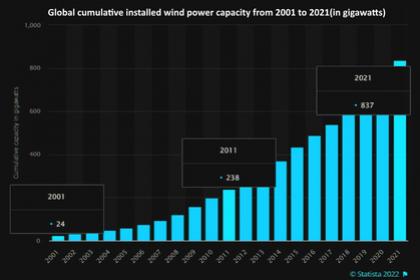
GLOBAL WIND CAPACITIES 837 GW
According to the Global Wind Energy Council (GWEC), the global wind capacity increased by 93.6 GW in 2021 (+12%), to 837 GW.
2022, April, 1, 11:15:00
GLOBAL CLIMATE DISRUPTION, HAVOC
“Despite growing pledges of climate action, global emissions are at an all-time high,” Mr. Guterres warned. And they continue to rise, he said, adding that “the latest science shows that climate disruption is causing havoc in every region already.
2022, March, 29, 13:30:00
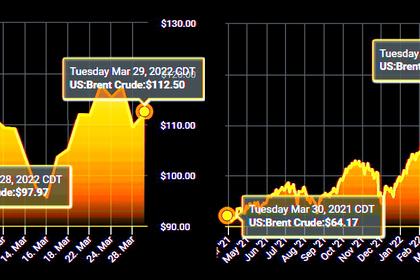
GLOBAL ENERGY, COMMODITY CRISIS
The sanctions against Russia are the hardest we have seen against any country to date and in particular the decision to freeze $600bn of Russian foreign reserves is a first, which will have huge consequences in the long-term.


