2022-08-08 11:55:00


U.S. EMPLOYMENT UP BY 528,000
U.S. BLS - August 5, 2022 - THE EMPLOYMENT SITUATION—JULY 2022
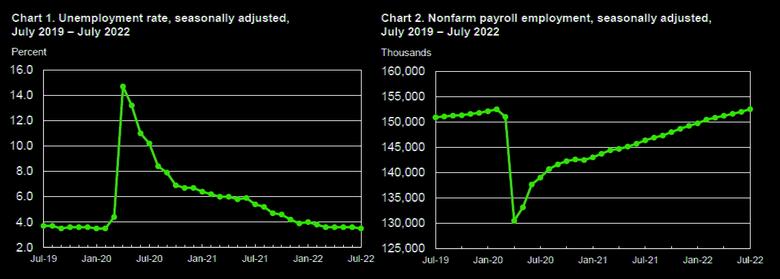
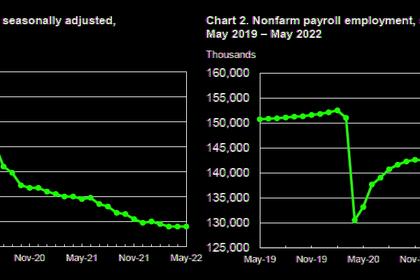
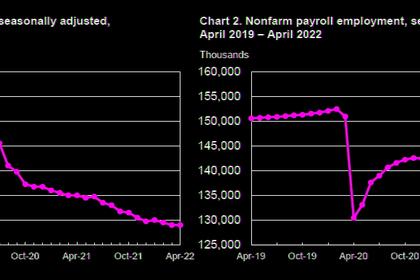
Total nonfarm payroll employment rose by 528,000 in July, and the unemployment rate edged down to 3.5 percent, the U.S. Bureau of Labor Statistics reported today. Job growth was widespread, led by gains in leisure and hospitality, professional and business services, and health care. Both total nonfarm employment and the unemployment rate have returned to their February 2020 pre-pandemic levels.
This news release presents statistics from two monthly surveys. The household survey measures labor force status, including unemployment, by demographic characteristics. The establishment survey measures nonfarm employment, hours, and earnings by industry. For more information about the concepts and statistical methodology used in these two surveys, see the Technical Note.
Household Survey Data
In July, the unemployment rate edged down to 3.5 percent, and the number of unemployed persons edged down to 5.7 million. These measures have returned to their levels in February 2020, prior to the coronavirus (COVID-19) pandemic. (See table A-1.)
Among the major worker groups, the unemployment rates for adult women (3.1 percent) and Whites (3.1 percent) declined in July. The jobless rates for adult men (3.2 percent), teenagers (11.5 percent), Blacks (6.0 percent), Asians (2.6 percent), and Hispanics (3.9 percent) showed little change over the month. (See tables A-1, A-2, and A-3.)
Among the unemployed, the number of permanent job losers, at 1.2 million in July, continued to trend down over the month and is 129,000 lower than in February 2020. The number of persons on temporary layoff, at 791,000 in July, changed little from the prior month and has essentially returned to its pre-pandemic level. (See table A-11.)
The number of long-term unemployed (those jobless for 27 weeks or more) decreased by 269,000 in July to 1.1 million. This measure has returned to its February 2020 level. The long-term unemployed accounted for 18.9 percent of the total unemployed in July. (See table A-12.)
The labor force participation rate, at 62.1 percent, and the employment-population ratio, at 60.0 percent, were little changed over the month. Both measures remain below their February 2020 values (63.4 percent and 61.2 percent, respectively). (See table A-1.)
The number of persons employed part time for economic reasons increased by 303,000 to 3.9 million in July. This rise reflected an increase in the number of persons whose hours were cut due to slack work or business conditions. The number of persons employed part time for economic reasons is below its February 2020 level of 4.4 million. These individuals, who would have preferred full-time employment, were working part time because their hours had been reduced or they were unable to find full-time jobs. (See table A-8.)
The number of persons not in the labor force who currently want a job was 5.9 million in July, little changed over the month. This measure is above its February 2020 level of 5.0 million. These individuals were not counted as unemployed because they were not actively looking for work during the 4 weeks preceding the survey or were unavailable to take a job. (See table A-1.)
Among those not in the labor force who wanted a job, the number of persons marginally attached to the labor force, at 1.5 million, was about unchanged in July. These individuals wanted and were available for work and had looked for a job sometime in the prior 12 months but had not looked for work in the 4 weeks preceding the survey. Discouraged workers, a subset of the marginally attached who believed that no jobs were available for them, numbered 424,000 in July, little changed from the prior month. (See Summary table A.)
Household Survey Supplemental Data
In July, 7.1 percent of employed persons teleworked because of the coronavirus pandemic, unchanged from the prior month. These data refer to employed persons who teleworked or worked at home for pay at some point in the 4 weeks preceding the survey specifically because of the pandemic.
In July, 2.2 million persons reported that they had been unable to work because their employer closed or lost business due to the pandemic—that is, they did not work at all or worked fewer hours at some point in the 4 weeks preceding the survey due to the pandemic. This measure is little changed from the previous month. Among those who reported in July that they were unable to work because of pandemicrelated closures or lost business, 25.0 percent received at least some pay from their employer for the hours not worked, little different from the previous month.
Among those not in the labor force in July, 548,000 persons were prevented from looking for work due to the pandemic, little changed from the prior month. (To be counted as unemployed, by definition, individuals must be either actively looking for work or on temporary layoff.)
These supplemental data come from questions added to the household survey beginning in May 2020 to help gauge the effects of the pandemic on the labor market. The data are not seasonally adjusted. Tables with estimates from the supplemental questions for all months are available online at www.bls.gov/cps/effects-of-the-coronavirus-covid-19-pandemic.htm.
Establishment Survey Data
Total nonfarm payroll employment rose by 528,000 in July, larger than the average monthly gain over the prior 4 months (+388,000). Job growth was widespread in July, led by gains in leisure and hospitality, professional and business services, and health care. (See table B-1.)
Total nonfarm employment has increased by 22.0 million since reaching a low in April 2020 and has returned to its pre-pandemic level. Private-sector employment is 629,000 higher than in February 2020, although several sectors have yet to recover. Government employment is 597,000 lower than its prepandemic level.
In July, leisure and hospitality added 96,000 jobs, as growth continued in food services and drinking places (+74,000). However, employment in leisure and hospitality is below its February 2020 level by 1.2 million, or 7.1 percent.
Employment in professional and business services continued to grow, with an increase of 89,000 in July. Job growth was widespread within the industry, including gains in management of companies and enterprises (+13,000), architectural and engineering services (+13,000), management and technical consulting services (+12,000), and scientific research and development services (+10,000).
Employment in professional and business services is 986,000 higher than in February 2020. Employment in health care rose by 70,000 in July. Job gains occurred in ambulatory health care services (+47,000), hospitals (+13,000), and nursing and residential care facilities (+9,000).
Employment in health care overall is below its February 2020 level by 78,000, or 0.5 percent. Employment in government rose by 57,000 in July but is below its February 2020 level by 597,000, or 2.6 percent. Over the month, employment increased by 37,000 in local government, mostly in education (+27,000). Employment in local government is below its February 2020 level by 555,000, or 3.8 percent, with the losses split between the education and non-education components.
Employment in construction increased by 32,000 in July, as specialty trade contractors added 22,000 jobs. Construction employment is 82,000 higher than in February 2020.
Manufacturing employment increased by 30,000 in July. Employment in durable goods industries rose by 21,000, with job gains in semiconductors and electronic components (+4,000) and miscellaneous durable goods manufacturing (+4,000). Employment in manufacturing is 41,000 above its February 2020 level.
In July, social assistance added 27,000 jobs, including a gain of 19,000 in individual and family services. Since February 2020, employment in social assistance is down by 53,000, or 1.2 percent.
Employment in retail trade increased by 22,000 in July, although it has shown no net change since March. In July, job gains occurred in food and beverage stores (+9,000) and general merchandise stores (+8,000). Retail trade employment is 208,000 above its level in February 2020.
In July, transportation and warehousing added 21,000 jobs. Employment rose in air transportation (+7,000) and support activities for transportation (+6,000). Employment in transportation and warehousing is 745,000 above its February 2020 level.
Information employment continued its upward trend in July (+13,000) and is 117,000 higher than in February 2020.
Employment in financial activities continued to trend up in July (+13,000). Employment in the industry is 95,000 above its level in February 2020.
Employment in mining rose by 7,000 in July, with gains in support activities for mining (+4,000) and oil and gas extraction (+2,000). Mining employment is 96,000 above a recent low in February 2021.
Employment showed little change over the month in wholesale trade and in other services.
In July, average hourly earnings for all employees on private nonfarm payrolls rose by 15 cents, or 0.5 percent, to $32.27. Over the past 12 months, average hourly earnings have increased by 5.2 percent. In July, average hourly earnings of private-sector production and nonsupervisory employees rose by 11 cents, or 0.4 percent, to $27.57. (See tables B-3 and B-8.)
In July, the average workweek for all employees on private nonfarm payrolls was 34.6 hours for the fifth month in a row. In manufacturing, the average workweek for all employees held at 40.4 hours, and overtime increased by 0.1 hour to 3.3 hours. The average workweek for production and nonsupervisory employees on private nonfarm payrolls remained unchanged at 34.0 hours. (See tables B-2 and B-7.)
The change in total nonfarm payroll employment for May was revised up by 2,000, from +384,000 to +386,000, and the change for June was revised up by 26,000, from +372,000 to +398,000. With these revisions, employment in May and June combined is 28,000 higher than previously reported.
(Monthly revisions result from additional reports received from businesses and government agencies since the last published estimates and from the recalculation of seasonal factors.)
-----
Earlier:
2022, June, 27, 11:30:00
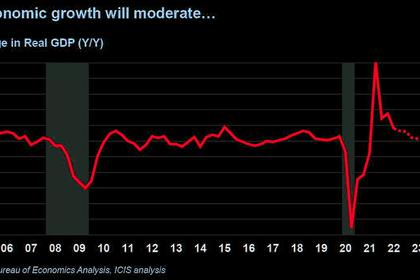
U.S. RECESSION 2022 - 23
Based on the median projection for the policy rate published at the June FOMC meeting, we expect the U.S. economy will slow in 2022-23 but narrowly avoid a recession.
2022, June, 20, 11:55:00
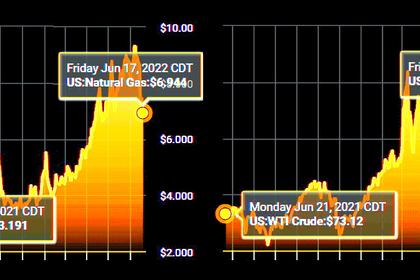
U.S. ENERGY DEFICIT
Just when it didn’t seem things couldn’t get worse — gasoline at $5 to $8 a gallon, supply shortages in everything from baby formula to new cars — comes the devastating news that many of us will endure electricity blackouts this summer.
2022, June, 16, 12:20:00
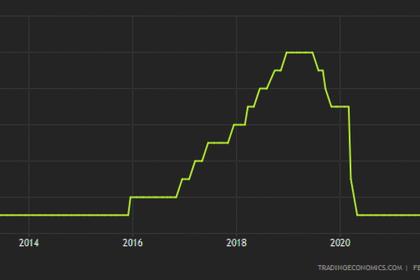
U.S. FEDERAL FUNDS RATE 1.5 - 1.75%
The Committee decided to raise the target range for the federal funds rate to 1‑1/2 to 1-3/4 percent and anticipates that ongoing increases in the target range will be appropriate.
2022, June, 6, 12:40:00
U.S. EMPLOYMENT UP BY 390,000
Total nonfarm payroll employment rose by 390,000 in May, and the unemployment rate remained at 3.6 percent, the U.S. Bureau of Labor Statistics reported
2022, May, 12, 13:30:00
U.S. EMPLOYMENT UP BY 428,000
Total nonfarm payroll employment increased by 428,000 in April, and the unemployment rate was unchanged at 3.6 percent, the U.S. Bureau of Labor Statistics reported


