2022-09-14 13:15:00


GLOBAL OIL DEMAND +3.1 MBD
OPEC - 13 September 2022 - OPEC MONTHLY OIL MARKER REPORT
Oil Market Highlights
Crude Oil Price Movements
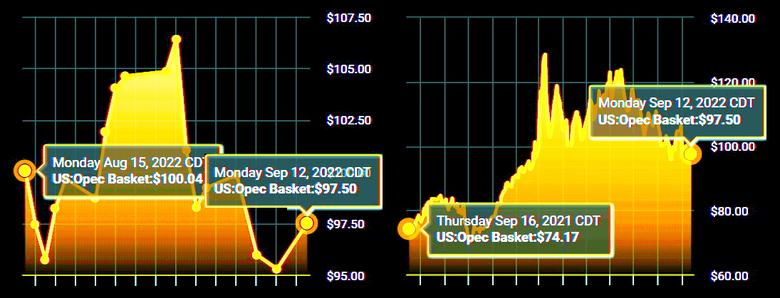
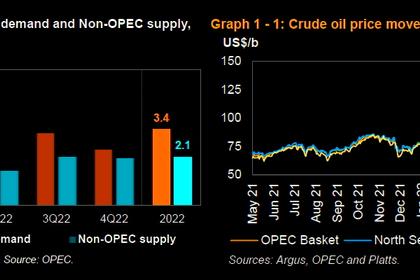
Crude oil spot prices fell for the second-consecutive month in August. The North Sea Dated benchmark declined by $13/b month-on-month (m-o-m), while Dubai fell by almost $7/b. The OPEC Reference Basket fell by $6.65, or 6.1%, to settle at $101.90/b. The ICE Brent front-month declined by $7.38, or 7.0%, to average $97.74/b. NYMEX WTI fell by $7.90, or 7.9%, to average $91.48/b. Consequently, the Brent-WTI futures spread widened by 52¢ to an average of $6.26/b. The market structure of all three major crude benchmarks – ICE Brent, NYMEX WTI and DME Oman – remained in backwardation but flattened significantly in August.
Hedge funds and other money managers further cut net long positions in the two major futures contracts. The paper and physical markets have become increasingly more disconnected. In a way, the market is in a state of schizophrenia, and this is creating a type of yo-yo market and sending erroneous signals at times when greater visibility and clarity and well-functioning markets are needed more than ever to allow market participants to efficiently hedge and manage the huge risks and uncertainties they face.
World Economy
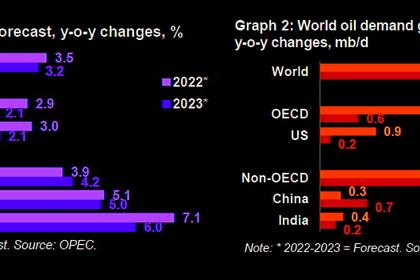
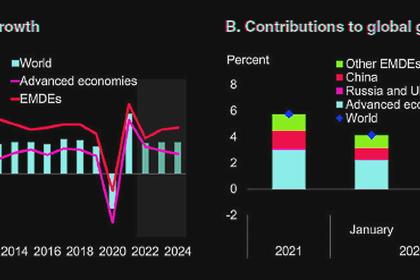
The global economic growth forecast remained similar to last month’s assessment at 3.1% for both 2022 and 2023, although some minor adjustments have been applied. For the US, economic growth remained unchanged for both 2022 and 2023 at 1.8% and 1.7%, respectively. Euro-zone economic growth for 2022 was revised down to 3.1%, but remained at 1.7% for 2023. Japan’s economic growth forecast remained unchanged at 1.4% for 2022, followed by growth of 1.6% in 2023. China’s 2022 growth forecast was revised down to 4.2 %, while the 2023 forecast remained unchanged at 5.0%. The forecast for India remained the same at 7.1% in 2022 and 6.0% in 2023. Brazil’s economic growth forecasts were revised up slightly for both 2022 and 2023, to stand at 1.5% and 1.6%, respectively. The 2022 forecast for Russia was unchanged, showing a contraction of 6.0%. This will be followed by growth of 1.2% in 2023. The global growth level has been well supported by consumption, which has shown a solid trend especially in advanced economies. However, some downside risks remain, stemming from ongoing geopolitical tensions, the pandemic, supply chain issues, rising inflation, high sovereign debt levels in many regions, and expected monetary tightening by US, EU and UK central banks.
World Oil Demand
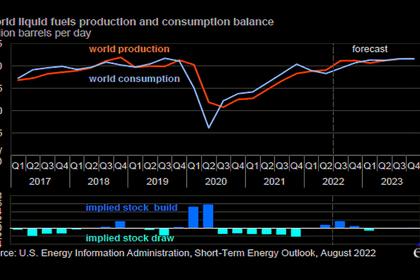
World oil demand growth in 2022 remained unchanged from the previous month’s assessment at a healthy level of 3.1 mb/d. This includes the recently observed trend for additional oil demand growth due to fuel switching in power generation. Oil demand in the OECD is estimated to grow by 1.6 mb/d in 2022, while non-OECD growth is expected at 1.5 mb/d. The second quarter of 2022 is revised higher amid better-thananticipated oil demand in the main OECD consuming countries, while the 3Q22 and 4Q22 have seen offsetting revisions. For 2023, the forecast for world oil demand growth also remained unchanged from the previous month’s assessment to 2.7 mb/d. The OECD is expected to grow by 0.6 mb/d and the non-OECD by 2.1 mb/d.
Oil demand in 2023 is expected to be supported by a still-solid economic performance in major consuming countries, as well as potential improvements in COVID-19 restrictions and reduced geopolitical uncertainties. World Oil Supply Non-OPEC liquids supply growth in 2022 remained broadly unchanged from last month’s assessment at 2.1 mb/d. A downward revision in Other Eurasia and OECD Americas was offset by an upward revision in Latin America and Other Asia. The main drivers of liquids supply growth for 2022 are expected to be the US, Canada, China, Brazil and Guyana, while the main production declines are expected in Indonesia and Norway. In 2023, the forecast for non-OPEC liquids production growth remained unchanged from last month’s assessment of 1.7 mb/d. The main drivers for 2023 growth are expected to be the US, Norway, Brazil, Canada and Guyana, whereas oil production declines are projected mainly in Russia and Azerbaijan. However, geopolitical concerns and uncertainties around the operational side as well as financial aspects of US production remain high. OPEC NGLs and non-conventional liquids are forecast to grow by 0.1 mb/d in 2022 to average 5.4 mb/d, and by 50 tb/d in 2023. In August, OPEC-13 crude oil production increased by 618 tb/d m-o-m to average 29.65 mb/d, according to available secondary sources.
Product Markets and Refining Operations
Refinery margins showed diverging trends in August. In the US Gulf Coast (USGC), margins declined moderately, with weakness mainly at the top of the barrel. This was on the back of weaker gasoline domestic consumption which exhibited signs of a slowdown amid concerns over high inflation, economic growth and the approaching end of the driving season. In contrast, refinery margins in Europe and Asia reversed trend, following the steep losses witnessed in July. This was mainly reflective of a continued decline in diesel availability, as high operational costs for European refiners due to strong natural gas prices weighed on diesel production. In Asia, strong diesel consumption in India and China, and open arbitrage for diesel flows from Asia to Europe, led to significant regional market support that resulted in higher refining gains. Over the month, global refinery runs slightly extended the upward trend, in line with expected seasonality, despite significant unplanned US refinery outages.
Tanker Market
Dirty tanker spot freight rates continued to pick up in August. They now stand at the top of the five-year range. VLCC rates rose a further 16% m-o-m on average, with all monitored routes seeing gains. Spot VLCCs rates on the Middle East to East route rose 17%. Aframax rates edged up 5% on average, with rates on the Caribbean to US East Coast route up 21%, offsetting declines on Mediterranean routes. Suezmax rates rose 4% on average. Clean rates fell for the second-month in a row, with rates on the NWE to the US East Coast down 6%.
Crude and Refined Products Trade
Preliminary data shows US crude imports fell in August after reaching a three-year high in July, while US crude exports set a new record high of just under 4.0 mb/d. Japan’s crude imports recovered from an 11-month low to average 2.6 mb/d in July, representing a strong y-o-y increase. Preliminary estimates show OECD Europe crude imports moved to higher levels in May, while crude exports remained at low levels as more locally produced supply remained in the region. Preliminary data shows China’s crude imports averaging 9.5 mb/d in August, representing a y-o-y decline of around 10%. China’s product exports remained soft August as increased outflows of gasoline, fuel oil and gasoil outpaced declines in jet fuel and naphtha. India’s crude imports edged 3% higher to average a robust 4.8 mb/d in July, with secondary sources showing Russian flows remaining above 1.0 mb/d. India’s product exports dropped a seasonal 18%, with losses in naphtha and gasoil.
Commercial Stock Movements
Preliminary July data sees total OECD commercial oil stocks up m-o-m by 18.1 mb. At 2,699 mb, they were 148 mb less than the same time a year ago, 279 mb lower than the latest five-year average and 271 mb below the 2015-2019 average. Within the components, crude and product stocks rose m-o-m by 6.4 mb and 11.7 mb, respectively. At 1,318 mb, OECD crude stocks were 45 mb lower than the same time a year ago, 128 mb below the latest five-year average and 144 mb lower than the 2015-2019 average. OECD product stocks stood at 1,380 mb, representing a deficit of 103 mb compared to the same time a year ago, 151 mb lower than the latest five-year average and 127 mb below the 2015-2019 average. In terms of days of forward cover, OECD commercial stocks rose by 0.3 days m-o-m in July to stand at 59.1 days. This is 2.7 days below July 2021 levels, 5.3 days less than the latest five-year average and 3.4 days lower than the 2015-2019 average.
Balance of Supply and Demand
Demand for OPEC crude in 2022 remains unchanged from the previous month’s assessment to stand at 28.9 mb/d. This is around 0.9 mb/d higher than in 2021. Demand for OPEC crude in 2023 was also unchanged from the previous assessment at 29.8 mb/d. This is around 0.9 mb/d higher than in 2022.
-----
Earlier:
2022, September, 5, 14:10:00
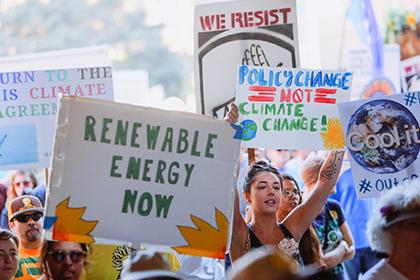
GLOBAL RENEWABLE ENERGY CHALLENGES
The economy will face additional challenges, beginning immediately but growing most rapidly in the period from 2035 to 2050 as all remaining fossil-fueled end uses are transitioned to electric end uses.
2022, August, 29, 12:20:00
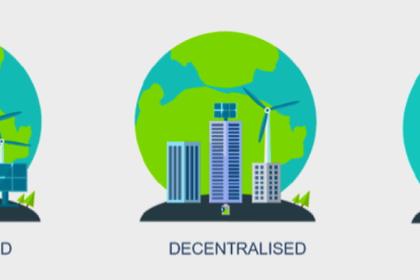
GLOBAL 3D ENERGY MEGATRENDS
The transformation of the electricity system is buoyed by three key megatrends: decarbonization, decentralization, and digitalization. Together, these primary trends, the so-called ‘3Ds’, are ushering in a new era of the electricity system by converging to produce game-changing disruptions and fundamentally reshaping the electricity system.
2022, August, 12, 09:00:00
GLOBAL OIL DEMAND 2022 - 23: 100.0 - 102.7 MBD
For 2023, the forecast for world oil demand growth remains unchanged at 2.7 mb/d, with total oil demand averaging 102.7 mb/d.
2022, July, 13, 11:40:00
GLOBAL OIL DEMAND 2022 - 23: 100.3 - 103.0 MBD
Total oil demand is projected to average 100.3 mb/d. For 2023, world oil demand growth is expected to reach 2.7 mb/d to average 103.0 mb/d.
2022, July, 5, 12:10:00
GLOBAL CHAOTIC ENERGY TRANSITION
Revolutions are messy things. Once underway, they get a life of their own. There is confusion and mistakes are made at the barricades. But once underway, they can’t be turned back; yesterday can’t be summoned rule tomorrow.
2022, June, 15, 14:55:00
GLOBAL OIL DEMAND 2022: +3.4 MBD ANEW
For 2022, world oil demand growth is broadly unchanged to stand at 3.4 mb/d.
2022, June, 15, 14:30:00
GLOBAL RISK & STAGFLATION
Global inflation has risen sharply from its lows in mid-2020, on rebounding global demand, supply bottlenecks, and soaring food and energy prices, especially since Russia’s invasion of Ukraine.


