NORTH AMERICA'S LNG EXPORTS WILL UP
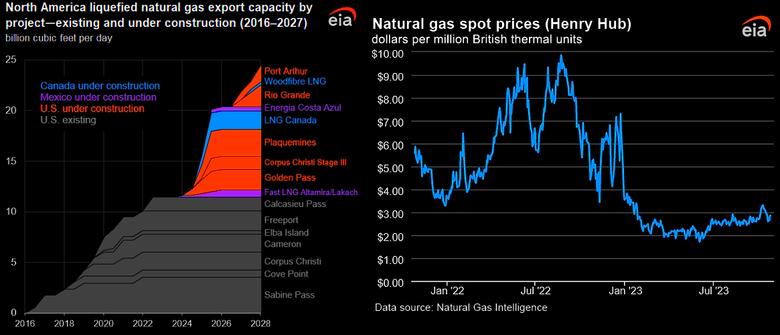
U.S. EIA - October 25, 2023 - LNG exports from North America are set to expand with new projects
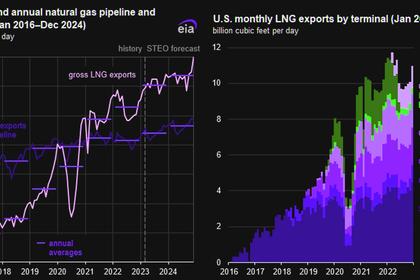
Over the next five years, we expect North America’s liquefied natural gas (LNG) export capacity to expand by 12.9 billion cubic feet per day (Bcf/d) as Mexico and Canada place into service their first LNG export terminals and the United States adds to its 11.4 Bcf/d of existing LNG capacity. By the end of 2027, we estimate LNG export capacity will grow by 1.1 Bcf/d in Mexico, 2.1 Bcf/d in Canada, and 9.7 Bcf/d in the United States from a total of ten new projects across the three countries.
Liquefied Natural Gas (LNG)
Pipeline receipts: Average natural gas deliveries to U.S. LNG export terminals fell by 4.1% (0.6 Bcf/d) week over week, averaging 13.7 Bcf/d, according to data from S&P Global Commodity Insights. Natural gas deliveries to terminals in South Texas declined by 2.9% (0.1 Bcf/d) to 4.1 Bcf/d. Natural gas deliveries to terminals in South Louisiana declined by 4.4% (0.4 Bcf/d) to 8.5 Bcf/d, and natural gas deliveries to terminals outside the Gulf Coast decreased by 2.6% (less than 0.1 Bcf/d) to 1.1 Bcf/d.
Vessels departing U.S. ports: Twenty-seven LNG vessels (nine from Sabine Pass; five from Freeport; four from Corpus Christi; three each from Cameron and Calcasieu Pass; two from Cove Point; and one from Elba Island) with a combined LNG-carrying capacity of 97 Bcf departed the United States between October 19 and October 25, according to shipping data provided by Bloomberg Finance, L.P.
Rig Count
According to Baker Hughes, for the week ending Tuesday, October 17, the natural gas rig count increased by 1 to 118 rigs. The Haynesville added three rigs, and two rigs were dropped among unidentified producing regions. The number of oil-directed rigs rose by 1 to 502 rigs. The Permian and the Granite Wash each added one rig, one rig was added among unidentified producing regions, and the Cana Woodford and the Eagle Ford each dropped one rig. The total rig count, which includes 4 miscellaneous rigs, now stands at 624 rigs.
Storage
The net injections into storage totaled 74 Bcf for the week ending October 20, compared with the five-year (2018–2022) average net injections of 66 Bcf and last year's net injections of 61 Bcf during the same week. Working natural gas stocks totaled 3,700 Bcf, which is 183 Bcf (5%) more than the five-year average and 313 Bcf (9%) more than last year at this time.
According to The Desk survey of natural gas analysts, estimates of the weekly net change to working natural gas stocks ranged from net injections of 73 Bcf to 89 Bcf, with a median estimate of 82 Bcf.
The average rate of injections into storage is 6% lower than the five-year average so far in the refill season (April through October). If the rate of injections into storage matched the five-year average of 7.1 Bcf/d for the remainder of the refill season, the total inventory would be 3,778 Bcf on October 31, which is 183 Bcf higher than the five-year average of 3,595 Bcf for that time of year.
-----
Earlier:

