2023-02-06 12:35:00


U.S. EMPLOYMENT UP BY 517,000
U.S. BLS - February 3, 2023 - THE EMPLOYMENT SITUATION— JANUARY 2023
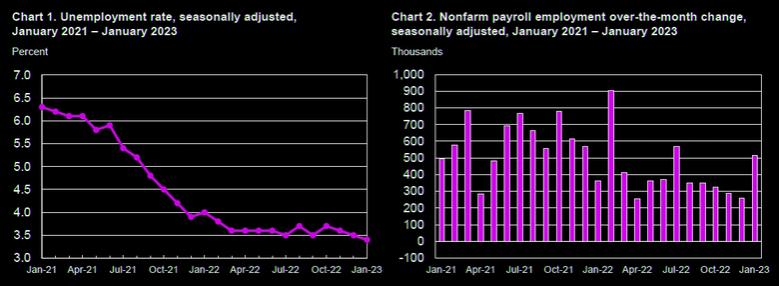
Total nonfarm payroll employment rose by 517,000 in January, and the unemployment rate changed little at 3.4 percent, the U.S. Bureau of Labor Statistics reported today. Job growth was widespread, led by gains in leisure and hospitality, professional and business services, and health care. Employment also increased in government, partially reflecting the return of workers from a strike.
This news release presents statistics from two monthly surveys. The household survey measures labor force status, including unemployment, by demographic characteristics. The establishment survey measures nonfarm employment, hours, and earnings by industry. For more information about the concepts and statistical methodology used in these two surveys, see the Technical Note.
Household Survey Data
Both the unemployment rate, at 3.4 percent, and the number of unemployed persons, at 5.7 million, changed little in January. The unemployment rate has shown little net movement since early 2022. (See table A-1. See the note on page 5 and tables B and C for more information about annual population adjustments to the household survey estimates.)
Among the major worker groups, the unemployment rates for adult men (3.2 percent), adult women (3.1 percent), teenagers (10.3 percent), Whites (3.1 percent), Blacks (5.4 percent), Asians (2.8 percent), and Hispanics (4.5 percent) showed little change in January. (See tables A-1, A-2, and A-3.)
The number of persons jobless less than 5 weeks decreased to 1.9 million in January. The number of long-term unemployed (those jobless for 27 weeks or more) was essentially unchanged at 1.1 million.
The long-term unemployed accounted for 19.4 percent of the total unemployed in January. (See table A- 12.)
In January, both the labor force participation rate, at 62.4 percent, and the employment-population ratio, at 60.2 percent, were unchanged after removing the effects of the annual adjustments to the population controls. These measures have shown little net change since early 2022 and remain below their pre-pandemic February 2020 levels (63.3 percent and 61.1 percent, respectively). (See table A-1. For additional information about the effects of the population adjustments, see table C.)
The number of persons employed part time for economic reasons, at 4.1 million, was little changed in January. These individuals, who would have preferred full-time employment, were working part time because their hours had been reduced or they were unable to find full-time jobs. (See table A-8.)
The number of persons not in the labor force who currently want a job was 5.3 million in January, little changed from the prior month. These individuals were not counted as unemployed because they were not actively looking for work during the 4 weeks preceding the survey or were unavailable to take a job. (See table A-1.)
Among those not in the labor force who wanted a job, the number of persons marginally attached to the labor force, at 1.4 million, changed little in January. These individuals wanted and were available for work and had looked for a job sometime in the prior 12 months but had not looked for work in the 4 weeks preceding the survey. The number of discouraged workers, a subset of the marginally attached who believed that no jobs were available for them, was also little changed over the month at 342,000. (See Summary table A.)
Establishment Survey Data
Total nonfarm payroll employment rose by 517,000 in January, compared with an average monthly gain of 401,000 in 2022. Job growth was widespread in January, led by gains in leisure and hospitality, professional and business services, and health care. Employment also increased in government, partially reflecting the return of workers from a strike. (See table B-1. See the note on page 4 and table A for more information about the annual benchmark process.)
Leisure and hospitality added 128,000 jobs in January compared with an average of 89,000 jobs per month in 2022. Over the month, food services and drinking places added 99,000 jobs, while employment continued to trend up in accommodation (+15,000). Employment in leisure and hospitality remains below its pre-pandemic February 2020 level by 495,000, or 2.9 percent.
In January, employment in professional and business services rose by 82,000, led by gains in professional, scientific, and technical services (+41,000). Job growth in professional and business services averaged 63,000 per month in 2022.
Government employment increased by 74,000 in January. Employment in state government education increased by 35,000, reflecting the return of university workers after a strike. Health care added 58,000 jobs in January. Job growth occurred in ambulatory health care services (+30,000), nursing and residential care facilities (+17,000), and hospitals (+11,000). In 2022, health care added an average of 47,000 jobs per month.
Employment in retail trade rose by 30,000 in January, following little net growth in 2022 (an average of +7,000 per month). In January, job gains in general merchandise retailers (+16,000) and in furniture, home furnishings, electronics, and appliance retailers (+7,000) were partially offset by a decline in health and personal care retailers (-6,000).
Construction added 25,000 jobs in January, reflecting an employment gain in specialty trade contractors (+22,000). Employment in the construction industry grew by an average of 22,000 per month in 2022.
In January, transportation and warehousing added 23,000 jobs, the same as the industry’s average monthly gain in 2022. Over the month, employment in support activities for transportation increased by 7,000.
Employment in social assistance increased by 21,000 in January, little different from the 2022 average gain of 19,000 per month.
Manufacturing employment continued to trend up in January (+19,000). In 2022, manufacturing added an average of 33,000 jobs per month.
Employment showed little change over the month in other major industries, including mining, quarrying, and oil and gas extraction; wholesale trade; information; financial activities; and other services.
In January, average hourly earnings for all employees on private nonfarm payrolls rose by 10 cents, or 0.3 percent, to $33.03. Over the past 12 months, average hourly earnings have increased by 4.4 percent. In January, average hourly earnings of private-sector production and nonsupervisory employees rose by 7 cents, or 0.2 percent, to $28.26. (See tables B-3 and B-8.)
The average workweek for all employees on private nonfarm payrolls rose by 0.3 hour to 34.7 hours in January. In manufacturing, the average workweek increased by 0.4 hour to 40.5 hours, and overtime increased by 0.1 hour to 3.1 hours. The average workweek for production and nonsupervisory employees on private nonfarm payrolls increased by 0.2 hour to 34.1 hours. (See tables B-2 and B-7.)
The change in total nonfarm payroll employment for November was revised up by 34,000, from +256,000 to +290,000, and the change for December was revised up by 37,000, from +223,000 to +260,000. With these revisions, employment gains in November and December combined were 71,000 higher than previously reported. (Monthly revisions result from additional reports received from businesses and government agencies since the last published estimates and from the recalculation of seasonal factors. The annual benchmark process also contributed to the November and December revisions.)
-----
Earlier:
2023, February, 3, 11:00:00
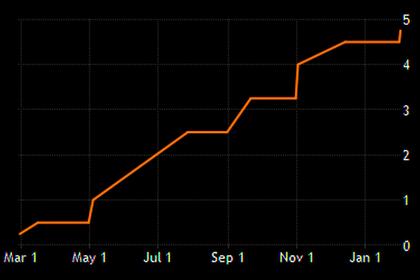
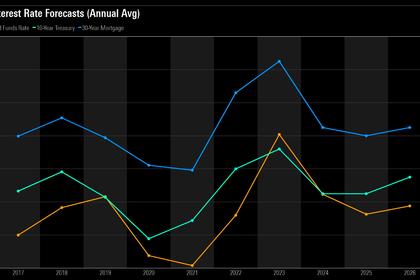
U.S. FEDERAL FUNDS RATE 4.5 - 4.75%
The Committee decided to raise the target range for the federal funds rate to 4-1/2 to 4-3/4 percent.
2023, January, 27, 09:50:00
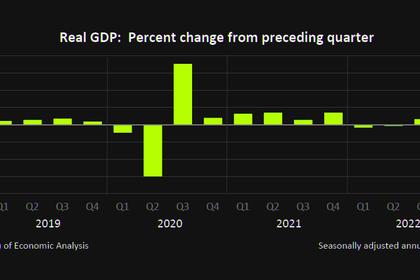
U.S. GDP UP BY 2.9%
Real gross domestic product (GDP) increased at an annual rate of 2.9 percent in the fourth quarter of 2022, according to the "advance" estimate released by the Bureau of Economic Analysis. In the third quarter, real GDP increased 3.2 percent.
2023, January, 9, 12:10:00
U.S. EMPLOYMENT UP BY 223,000
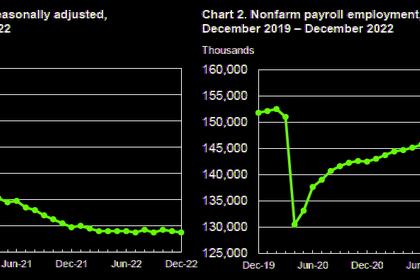
Total nonfarm payroll employment increased by 223,000 in December, and the unemployment rate edged down to 3.5 percent, the U.S. Bureau of Labor Statistics reported.
2022, December, 16, 12:00:00
U.S. FEDERAL FUNDS RATE 4.25 - 4.50%
The Committee decided to raise the target range for the federal funds rate to 4-1/4 to 4-1/2 percent.
2022, December, 5, 11:20:00
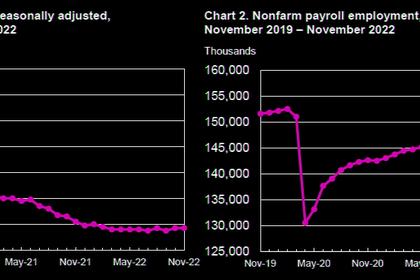
U.S. EMPLOYMENT UP BY 263,000
Total nonfarm payroll employment increased by 263,000 in November, and the unemployment rate was unchanged at 3.7 percent.
2022, November, 9, 10:30:00
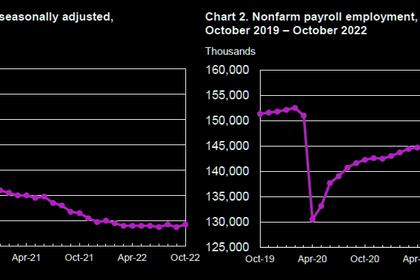
U.S. EMPLOYMENT UP BY 261,000
Total nonfarm payroll employment increased by 261,000 in October, and the unemployment rate rose to 3.7 percent, the U.S. Bureau of Labor Statistics reported.
2022, October, 10, 12:30:00
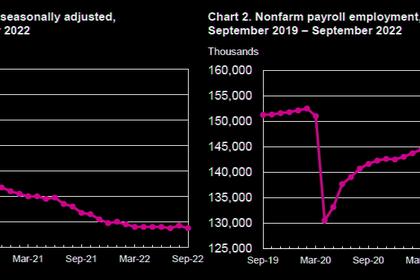
U.S. EMPLOYMENT UP BY 263,000
Total nonfarm payroll employment increased by 263,000 in September, and the unemployment rate edged down to 3.5 percent, the U.S. Bureau of Labor Statistics reported


