GLOBAL GAS CONSUMPTION + 1%

GECF - 5 April 2023 - ANNUAL GAS MARKET REPORT 2023
Executive Summary
Gas markets in 2022 were characterised by significant turbulence and fundamental changes, mainly driven by geopolitical developments and underinvestment in the industry over the past decade. Spot gas and LNG prices in Europe and Asia skyrocketed to record highs at the end of summer, while experiencing significant volatility throughout the year. This was mainly attributed to a tight LNG market as Europe’s LNG demand surged to replace lower pipeline gas imports into the region. Amidst record-high spot prices, various countries around the world had to switch from gas to coal and even lignite, chiefly in the power generation and industrial sectors. Energy security concerns took precedence over climate change mitigation goals, with policymakers focusing on meeting the energy needs of their people, and countries heading to solve the energy trilemma of achieving security, affordability and sustainability.
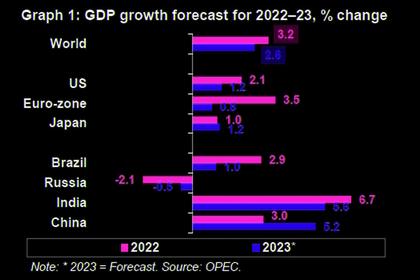
The global economy encountered significant headwinds in 2022, and the outlook is skewed to the downside, with global GDP growth expected to slow further in 2023 Global GDP growth decelerated to an estimated 3.4% in 2022, driven by soaring energy and commodity prices, rising inflation, tightening financial conditions, supply chain disruptions, extensive lockdowns in China, and geopolitical developments in Europe. In the meantime, global inflation reached 8.8%, the highest level since 2008. In 2023, global GDP growth is expected to slow to 2.9%, while global inflation is likely to remain relatively high, although gradually declining to an estimated 6.6%.
Following a record rebound in 2021, global gas consumption recorded a decline in 2022, but is expected to resume growth in 2023 In 2022, global gas consumption is estimated to have recorded a decline of 0.4% y-o-y to reach 4.03 trillion cubic metres (tcm). Mild winter weather in Q1 and Q4 2022 in the Northern Hemisphere resulted in lower gas consumption in the residential sector, while high gas prices affected gas consumption in the industrial sector, which led to demand decline in various countries of Asia Pacific and Europe. In the meantime, US gas consumption rose by 5% y-o-y driven by a boost in gas use in the power generation sector amidst tightening coal supply and rising coal prices. In 2023, global gas consumption is forecasted to increase by around 1% y-o-y, with US, China, and some emerging countries in Asia Pacific driving the growth.
Power generation remains the largest driver of global gas consumption The power generation sector is still the largest consumer of gas, with a share of 44% of the global gas consumption in 2022. Gas consumption in the power sector decreased by 0.2% y-o-y to 6,050 terawatt hour (TWh), driven by gas-to-coal switching in various regions amidst high gas prices, which made natural gas less competitive compared to other fuels. Nonetheless, power generation will likely remain the largest driver of global gas consumption, as more countries transition away from coal-fired power plants.
High gas prices led to an increase in production costs for heavily gas-reliant industries. Global gas consumption in the industrial sector is estimated to have declined by 4% y-o-y to 740 billion cubic metres (bcm) in 2022 due to high gas prices, which caused a reduction in production or partial shutdown in some heavy industries such as cement, fertiliser, and steel. However, with the expected lower gas prices, gas consumption in the industrial sector is likely to rise in 2023, as natural gas remains a cost-effective, reliable, and environmentally friendly energy source for many industries.
Global gas production registered a slight decline in 2022, but is on the path to recovery. In 2022, global gas production decreased by 0.1% to 4.04 tcm, primarily due to a drop in global gas demand. The Eurasia and Africa regions experienced the most significant decline, while North America, the Middle East, Latin America and the Caribbean (LAC), Europe, and Asia Pacific recorded an increase in gas output. Global gas production is expected to increase by around 1% in 2023, driven by North America, LAC, the Middle East, and Africa.
Unconventional gas production continues to be the main driver of production growth. Unconventional natural gas production has been growing steadily over recent years, with its share in global production increasing to 31% in 2022. In the meantime, a decline in conventional gas production was the main reason for the overall decrease in gas output in 2022. Associated gas and offshore fields represent 14% and 29% of global gas production, respectively.
Discovered gas volumes made 2022 a significant year for exploration Over 600 bcm of natural gas was discovered in 2022, a 16% y-o-y increase, representing 39% of the total discovered oil and gas volumes. Nevertheless, the number of exploration wells was less than half the average number of the pre-pandemic levels, highlighting continued underinvestment in exploration. The Middle East and Europe drove the increase in global gas discoveries, while LAC and Africa did so in liquids. Oil and gas investment continues to increase, possibly exceeding pre-pandemic levels in 2023, but still remains much lower than the level of 2014 Oil and gas investment has increased by 7% y-o-y to reach $718 billion, partly due to higher petroleum services and EPC costs. In 2023, oil and gas investment is expected to rise further, on the back of greater investment in the upstream industry and LNG import terminals. However, several looming uncertainties, including a slowdown in global economic growth, tight financial conditions, inflation, and high energy price volatility, may deter investment.
CCUS and hydrogen gain momentum, but still a long way to go The number of announced CCS/CCUS projects and associated abatement capacity has significantly increased, while hydrogen also emerged as a potential pathway for decarbonisation, with a prominent increase in the announced capacity. However, the number of CCS/CCUS and hydrogen projects that have already reached the FID stage is still far from the required scale.
Pipeline gas trade contracted in 2022. The European region, as the world-leading market for pipeline gas trade, accounts for three-fifths of net flows on the global level. Total pipeline gas imports to the EU in 2022 reached 203 bcm, which was 26% or 70 bcm lower y-o-y. The EU’s imports from Russia fell sharply, which was only partially offset by increases from Norway and Azerbaijan. Pipeline gas imports in the EU may decline further in 2023. In the meantime, the Asia Pacific markets are likely to record higher pipeline gas trade as Russia pivots strongly towards the region, with its exports to China expected to increase by 40% y-o-y in 2023.
Global LNG flows shifted away from Asia Pacific to Europe in 2022, but a recovery in imports in Asia Pacific is expected in 2023. Global LNG imports expanded by 6% or 21 million tonnes (Mt) y-o-y to 399 Mt in 2022, driven by a surge in LNG imports in Europe, which offset a decline in LNG imports in Asia Pacific and LAC. Europe’s LNG imports surged by 62% (49 Mt) to a record high, amidst lower pipeline gas imports. China drove the 7% (20 Mt) decline in Asia Pacific’s LNG imports. Unlike previous years, Europe displaced Asia Pacific to become the premium market for LNG. In 2023, global LNG imports are forecasted to increase by 4-4.5% (16- 18 Mt) y-o-y to 416 Mt. China and countries in the Indian sub-continent and Southeast Asia are forecasted to account for the bulk of incremental increase in LNG imports with an additional 13-15 Mt of LNG imports.
FIDs in new liquefaction capacities declined in 2022, but an acceleration in FIDs is expected in the short term to meet the strong growth for LNG demand in the medium-term. The liquefaction capacities that reached FID in 2022 declined to 34 million tonnes per annum (Mtpa), from 52 Mtpa in 2021, with 68% of the capacities coming from the US, followed by Suriname, Congo, Canada, and Malaysia. In 2023 and 2024, almost 160 Mtpa of new liquefaction capacities are targeting FID, led by the US as well as Qatar, Mexico and the UAE. This is supported by strong LNG contracting over the past two years and expectations for a tight LNG market up until the middle of this decade. At the end of 2022, global liquefaction and regasification capacities stood at 486 Mtpa and 1,037 Mtpa, respectively.
LNG shipping market grows to accommodate the increase in global LNG trade Less than 30 new LNG carriers were commissioned in 2022, representing the slowest increase since 2013, while the global LNG carrier fleet surpassed 670 carriers. Spot charter rates for LNG carriers witnessed record highs in the autumn of 2022. This, along with a rise in the cost of LNG shipping fuels, contributed to increasing LNG shipping costs.
Strong gas storage build during 2022, along with reduced demand over the winter of 2022-23, placed the EU gas stocks at record high levels The level of underground gas storage in the EU at the start of 2022 was the lowest in the previous five years. Concern for security of supply during the subsequent winter prompted the European Commission to implement legislation for gas storage sites to be filled to 80% capacity by 1 November 2022. Due to the strong storage build and lower than anticipated withdrawals, gas storage at the end of the 2022-23 winter season remains at a much higher level than the 5-year average.
Gas and LNG spot prices surpassed historical highs and recorded extreme volatility in 2022, fuelled by geopolitical developments, growing concerns for security of gas supply, and a tightening global LNG market. In 2022, TTF spot gas prices in Europe averaged $38/MMBtu, 136% higher y-o-y, while NEA LNG spot prices in Asia averaged $33/MMBtu, a 79% increase y-o-y. This shift in prices made Europe the premier LNG market for suppliers, as TTF spot prices maintained a high premium over Asian LNG spot prices. In 2023, spot prices are expected to remain volatile. Factors such as a relatively mild winter, high gas storage levels in Europe, and weakened gas demand growth in the midst of a slowdown in global economic growth may exert downward pressure on spot prices. However, there may be some upward pressure on spot prices this year due to the anticipated recovery in China’s gas demand, higher imports in price-sensitive countries in Asia Pacific, and a rebound in gas demand in the industrial sector. Additionally, any further supply disruptions or extreme weather conditions during the year may also boost prices.
-----
Earlier:
