
Analysis
2017, April, 27, 18:45:00
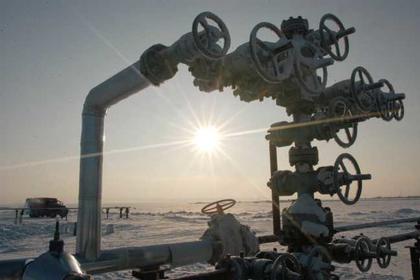
OIL PRICE: $40
“If OPEC and the coalition don’t extend the agreement to continue cuts, that price floor will go,” he said. “Without it, prices would fall, and there’s nothing to stop oil going below $40 a barrel.”
2017, April, 27, 18:40:00
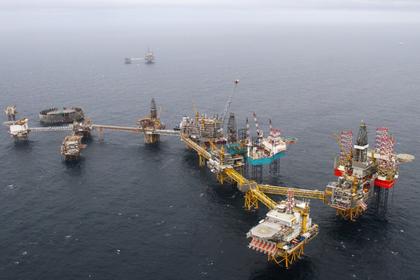
NORWAY'S OIL PRODUCTION UP 63 TBD
Preliminary production figures for March 2017 show an average daily production of 2 145 000 barrels of oil, NGL and condensate, which is an increase of 63 000 barrels per day (approx. 3 percent) compared to February.
2017, April, 25, 21:58:00
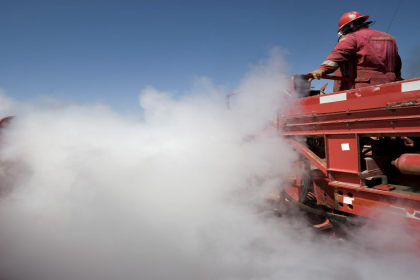
HALLIBURTON NET LOSS $32 MLN
Halliburton Company (NYSE:HAL) announced a loss from continuing operations of $32 million, or $0.04 per diluted share, for the first quarter of 2017.
2017, April, 25, 18:50:00
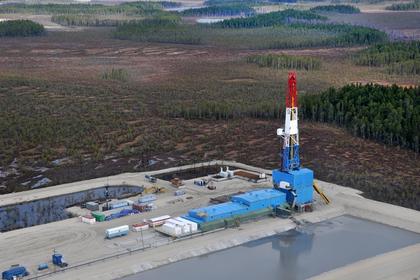
OIL PRICE: ABOVE $51
The June crude oil contract on the New York Mercantile Exchange dropped 39¢ on Apr. 24 to close at $49.23/bbl. The July contract decreased 39¢ to $49.58/bbl.
The natural gas price for May fell 3.5¢ to a rounded $3.07/MMbtu. The Henry Hub cash gas price was $2.98, down 6¢.
The Brent crude contract for June on London’s ICE fell 36¢ to settle at $51.60/bbl. The July contract was down 31¢ to $52.13/bbl. The May gas oil contract declined $1.75 to $465.75/tonne.
OPEC’s basket of crudes closed Apr. 24 at $49.64/bbl, down 35¢.
2017, April, 25, 18:30:00
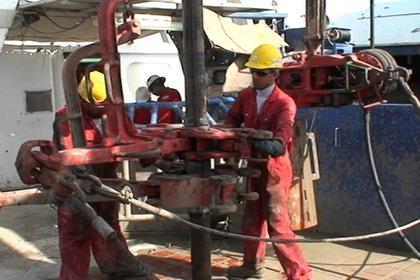
U.S. RIGS UP 10
U.S. Rig Count is up 426 rigs from last year's count of 431, with oil rigs up 345, gas rigs up 79, and miscellaneous rigs up 2.
Canadian Rig Count is up 59 rigs from last year's count of 40, with oil rigs up 21, gas rigs up 39, and miscellaneous rigs down 1.
2017, April, 22, 12:05:00
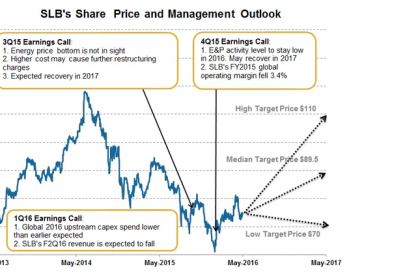
SCHLUMBERGER NET INCOME $279 MLN
Schlumberger Announces First-Quarter 2017 Results:
- Revenue of $6.9 billion decreased 3% sequentially
- GAAP EPS, including Cameron integration charges of $0.05 per share, was $0.20
- EPS, excluding Cameron integration charges, was $0.25
- Cash flow from operations was $656 million
- Quarterly cash dividend of $0.50 per share was approved
2017, April, 21, 20:40:00
U.S. PETROLEUM DELIVERIES UP 0.2%
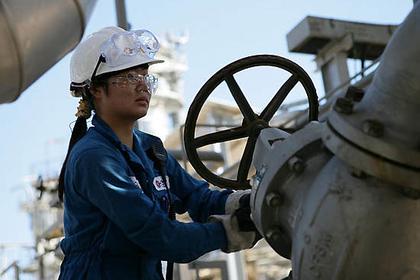
Total petroleum deliveries in March moved up 0.2 percent from March 2016 to average nearly 19.7 million barrels per day. These were the highest March deliveries in nine years, since 2008. For the first quarter of 2017, total domestic petroleum deliveries, a measure of U.S. petroleum demand, were up 0.4 percent compared with the first quarter of 2016 to average 19.5 million barrels per day. These were the highest first quarter deliveries since 2008. According to the U.S. Bureau of Labor Statistics (BLS) April 7, 2017 report, the U.S. added 98,000 jobs in March. In addition, the unemployment rate (4.5 percent) and the number of unemployed persons (7.2 million) were down from prior month and the prior year.
2017, April, 20, 19:35:00
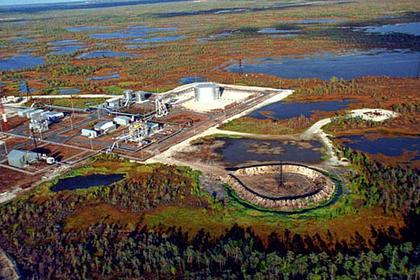
OIL PRICE: STILL ABOVE $54
Brent crude futures were at $53.34 per barrel at 0715 GMT (3:15 a.m. ET), up 41 cents, or 0.77 percent, from their last close.
U.S. West Texas Intermediate (WTI) crude futures were up 32 cents, or 0.63 percent, to $50.76 a barrel.
2017, April, 19, 18:00:00
OIL PRICE: STILL ABOVE $54
The crude oil contract for May delivery on the New York Mercantile Exchange fell 53¢ on Apr. 17 to close at $52.65/bbl. The June contract lost 49¢ to $53.11/bbl.
The natural gas price for May declined 6.4¢ to a rounded $3.16/MMbtu. The Henry Hub cash gas price closed Apr. 17 at $3.06/MMbtu, up 8¢.
The Brent crude contract for June on London’s ICE also declined 53¢, settling at $55.36/bbl. The July contract was down 49¢ to $55.88/bbl. The gas oil contract for May lost 25¢ at $497.75/tonne.
The average price for OPEC’s basket of benchmark crudes on Apr. 17 was $52.94/bbl, down 43¢.
2017, April, 14, 18:40:00
IEA: OIL MARKET BALANCE
It can be argued confidently that the market is already very close to balance, and as more data becomes available this will become clearer.
2017, April, 14, 18:30:00
U.S. RIGS UP 8
U.S. Rig Count is up 407 rigs from last year's count of 440, with oil rigs up 332, gas rigs up 73, and miscellaneous rigs up 2.
Canadian Rig Count is up 78 rigs from last year's count of 40, with oil rigs up 30 and gas rigs up 48.

2017, April, 12, 18:50:00
OIL PRICES FORECAST: $54 - $57
North Sea Brent crude oil spot prices averaged $52 per barrel (b) in March, $3/b lower than the February average. EIA forecasts Brent prices to average $54/b in 2017 and $57/b in 2018. West Texas Intermediate (WTI) crude oil prices are forecast to average $2/b less than Brent prices in both 2017 and 2018.
2017, April, 12, 18:45:00
GAS PRICES FORECAST UP $0.15
For 2017, Henry Hub prices are projected to average $3.10/MMBtu, 7 cents above what was indicated in March. The forecast for 2018 stayed steady at $3.45/MMBtu.
2017, April, 10, 19:05:00
OIL PRICES: ABOVE $55
West Texas Intermediate for May delivery rose as much as 38 cents to $52.62 a barrel on the New York Mercantile Exchange and was at $52.38 at 12:21 p.m. in Hong Kong, on course for its highest close since March 7. Total volume traded was about 2 percent above the 100-day average. The contract gained 54 cents to $52.24 on Friday.
Brent for June settlement climbed as much as 28 cents, or 0.5 percent, to $55.52 a barrel on the London-based ICE Futures Europe exchange. Prices increased 35 cents to $55.24 on Friday. The global benchmark crude was at a premium of $2.55 to June WTI.
2017, April, 10, 18:30:00
U.S. RIGS UP 15 AGAIN
U.S. Rig Count is up 396 rigs from last year's count of 443, with oil rigs up 318, gas rigs up 76, and miscellaneous rigs up 2.
Canadian Rig Count is up 91 rigs from last year's count of 41, with oil rigs up 34 and gas rigs up 57.