
Analysis
2017, November, 20, 08:50:00
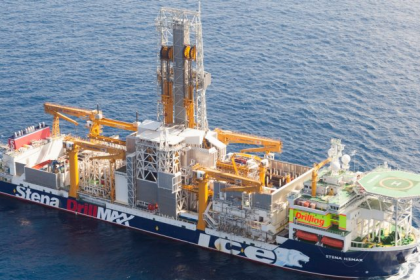
U.S. RIGS UP 8 TO 915
U.S. Rig Count is up 327 rigs from last year's count of 588, with oil rigs up 267, gas rigs up 61, and miscellaneous rigs down 1 to 1.
Canada Rig Count is up 24 rigs from last year's count of 184, with oil rigs up 9 and gas rigs up 15.
2017, November, 15, 15:15:00
IEA: GLOBAL ENERGY DEMAND UP BY 30%
Global energy needs rise more slowly than in the past but still expand by 30% between today and 2040. This is the equivalent of adding another China and India to today’s global demand.
2017, November, 15, 12:32:00
PETROBRAS NET INCOME R$ 5,031 MLN
PETROBRAS - Net Income of R$ 5,031 million in 9M-2017, compared to a loss of R$ 17,334 million in 9M-2016.
2017, November, 14, 17:30:00
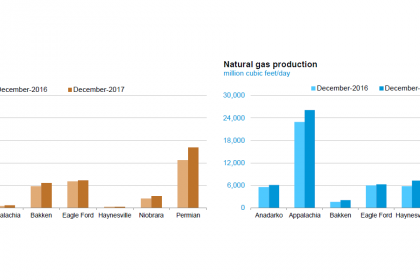
U.S. OIL + 80 TBD, GAS + 779 MCFD
EIA - Crude oil production from the major US onshore regions is forecast to increase 80,000 b/d month-over-month in December to 6.174 million b/d, gas production to increase 779 million cubic feet/day.
2017, November, 13, 10:10:00
TRANSCANADA NET INCOME $2.136 BLN
TransCanada Corporation (TSX, NYSE: TRP) (TransCanada or the Company) announced net income attributable to common shares for third quarter 2017 of $612 million or $0.70 per share compared to a net loss of $135 million or $0.17 per share for the same period in 2016. Comparable earnings for third quarter 2017 were $614 million or $0.70 per share compared to $622 million or $0.78 per share for the same period in 2016. TransCanada's Board of Directors also declared a quarterly dividend of $0.625 per common share for the quarter ending December 31, 2017, equivalent to $2.50 per common share on an annualized basis.
2017, November, 13, 10:00:00
U.S. RIGS UP 9 TO 907
U.S. Rig Count is up 339 rigs from last year's count of 568, with oil rigs up 286, gas rigs up 54, and miscellaneous rigs down 1 to 1.
Canada Rig Count is up 27 rigs from last year's count of 176, with oil rigs up 19 and gas rigs up 8.
2017, November, 9, 14:00:00
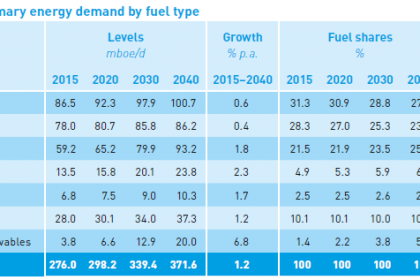
OPEC: 2040 GLOBAL ENERGY CHANGES
Within the grouping of Developing countries, India and China are the two nations with the largest additional energy demand over the forecast period, both in the range of 22–23 mboe/d.
2017, November, 9, 13:55:00
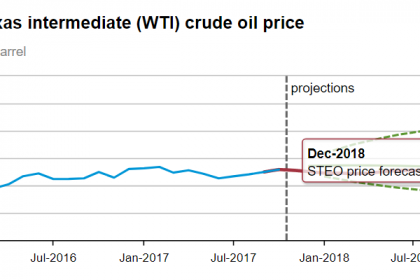
EIA: OIL PRICE $53 - $56
North Sea Brent crude oil spot prices averaged $58 per barrel (b) in October, an increase of $1/b from the average in September. EIA forecasts Brent spot prices to average $53/b in 2017 and $56/b in 2018.

2017, November, 9, 13:50:00
EIA: NUCLEAR ENERGY WILL UP
EIA projects that global nuclear capacity will grow at an average annual rate of 1.6% from 2016 through 2040, led predominantly by countries outside of the Organization for Economic Cooperation and Development (OECD). EIA expects China to continue leading world nuclear growth, followed by India. This growth is expected to offset declines in nuclear capacity in the United States, Japan, and countries in Europe.
2017, November, 9, 13:45:00
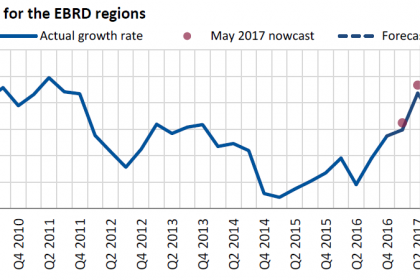
EUROPEAN ECONOMY UP 3.3%
Average growth across the EBRD region is seen at 3.3 per cent this year, a rise of 0.9 percentage points against the previous forecast from May, and compared with growth of just 1.9 per cent in 2016.
The economy in Russia, the largest in the EBRD region and a major influence on output in many other EBRD countries of operations, has now pulled out of recession after a cumulative contraction of 3 per cent over the last two years. Russia is expected to see GDP growth of 1.8 and 1.7 per cent in 2017 and 2018, respectively.
2017, November, 9, 13:30:00
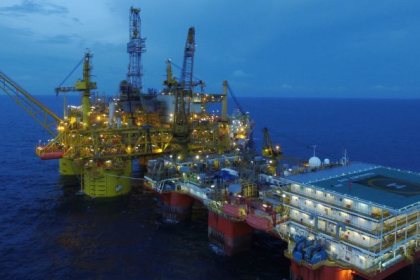
WORLDWIDE RIG COUNT DOWN 4 TO 2,077
The worldwide rig count for October 2017 was 2,077, down 4 from the 2,081 counted in September 2017, and up 457 from the 1,620 counted in October 2016.

2017, November, 7, 12:20:00
U.S. DEFICIT $43.5 BLN
The U.S. Census Bureau and the U.S. Bureau of Economic Analysis, through the Department of Commerce, announced today that the goods and services deficit was $43.5 billion in September, up $0.7 billion from $42.8 billion in August, revised. September exports were $196.8 billion, $2.1 billion more than August exports. September imports were $240.3 billion, $2.8 billion more than August imports.
2017, November, 7, 12:05:00
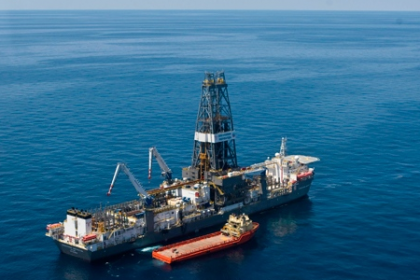
U.S. RIGS DOWN 11 TO 898
U.S. Rig Count is up 329 rigs from last year's count of 569, with oil rigs up 279, gas rigs up 52, and miscellaneous rigs down 2 to 2.
Canada Rig Count is up 38 rigs from last year's count of 154, with oil rigs up 24 and gas rigs up 14.
2017, November, 3, 12:15:00
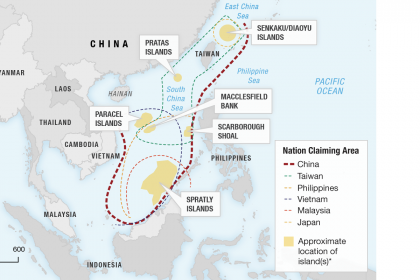
SOUTH CHINA SEA LNG
The South China Sea is a major route for liquefied natural gas (LNG) trade, and in 2016, almost 40% of global LNG trade, or about 4.7 trillion cubic feet (Tcf), passed through the South China Sea.
2017, November, 3, 12:05:00
SHELL INCOME $9.2 BLN
Compared with the third quarter 2016, CCS earnings attributable to shareholders excluding identified items increased to $4.1 billion, reflecting higher contributions from Downstream, Upstream and Integrated Gas. Earnings benefited mainly from stronger refining and chemicals industry conditions, increased realised oil and gas prices and higher production from new fields, offsetting the impact of field declines and divestments.