All publications by tag «DEFICIT»
2021, August, 6, 11:20:00
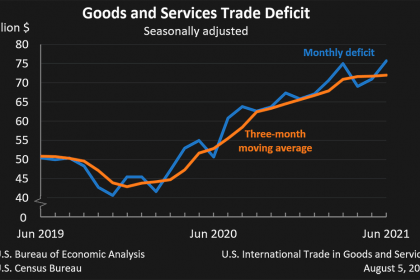
U.S. INTERNATIONAL TRADE DEFICIT UP TO $75.7 BLN
The U.S. goods and services deficit was $75.7 billion in June, up $4.8 billion from $71.0 billion in May,
2021, July, 5, 12:50:00
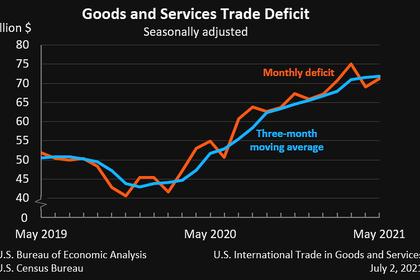
U.S. INTERNATIONAL TRADE DEFICIT UP TO $71.2 BLN
The U.S. goods and services deficit was $71.2 billion in May, up $2.2 billion from $69.1 billion in April
2021, May, 13, 17:15:00
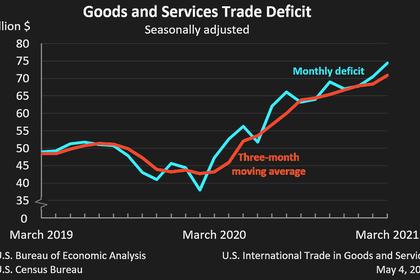
U.S. INTERNATIONAL TRADE DEFICIT UP TO $74.4 BLN
The U.S. goods and services deficit was $74.4 billion in March, up $3.9 billion from $70.5 billion in February
2020, December, 21, 12:35:00
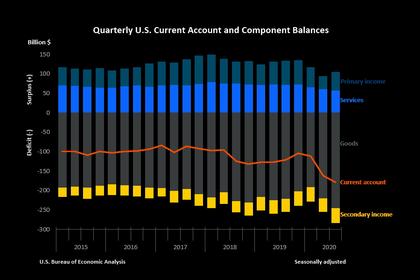
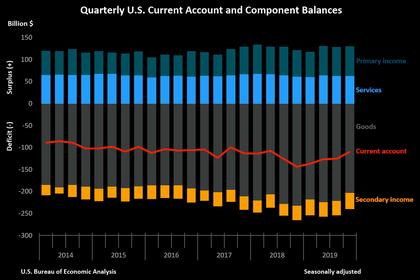
U.S. CURRENT ACCOUNT DEFICIT UP TO $178.5 BLN
The U.S. current account deficit, which reflects the combined balances on trade in goods and services and income flows between U.S. residents and residents of other countries, widened by $17.2 billion, or 10.6 percent, to $178.5 billion in the third quarter of 2020
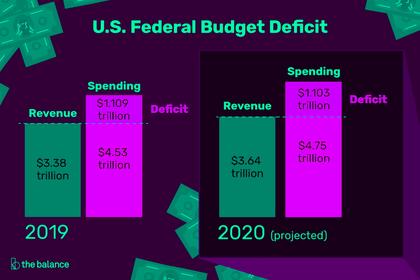
2020, April, 13, 11:20:00
U.S. BUDGET DEFICIT $744 BLN
U.S. outlays from a $2.2 trillion rescue package passed on March 27 are only just beginning.
2020, March, 20, 12:10:00
U.S. CURRENT ACCOUNT DEFICIT $110 BLN
The U.S. current account deficit, which reflects the combined balances on trade in goods and services and income flows between U.S. residents and residents of other countries, narrowed by $15.6 billion, or 12.4 percent, to $109.8 billion in the fourth quarter of 2019
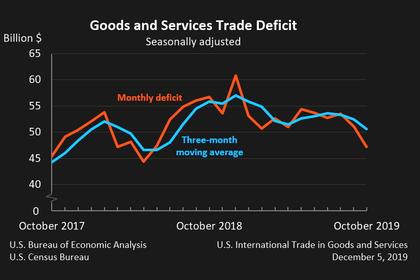
2019, December, 6, 13:05:00
U.S. INTERNATIONAL TRADE DEFICIT $47.2 BLN
The U.S. Census Bureau and the U.S. Bureau of Economic Analysis announced today that the goods and services deficit was $47.2 billion in October, down $3.9 billion from $51.1 billion in September,
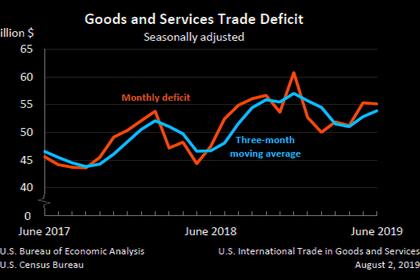
2019, August, 5, 13:25:00
U.S. TRADE DEFICIT $55.2 BLN
The U.S. Census Bureau and the U.S. Bureau of Economic Analysis announced today that the goods and services deficit was $55.2 billion in June, down $0.2 billion from $55.3 billion in May, revised.
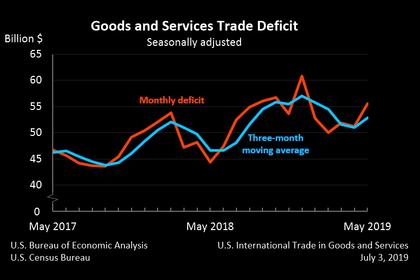
2019, July, 4, 16:15:00
U.S. TRADE DEFICIT $55.5 BLN
The U.S. Census Bureau and the U.S. Bureau of Economic Analysis announced today that the goods and services deficit was $55.5 billion in May, up $4.3 billion from $51.2 billion in April, revised.
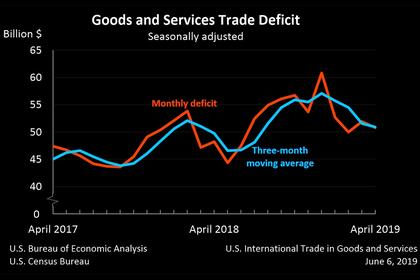
2019, June, 7, 11:35:00
U.S. TRADE DEFICIT UPDOWN ANEW
Year-to-date, the goods and services deficit increased $4.1 billion, or 2.0 percent, from the same period in 2018. Exports increased $8.3 billion or 1.0 percent. Imports increased $12.4 billion or 1.2 percent.


