
Analysis

2017, July, 24, 13:55:00
OIL OUTPUT CONSENSUS
With prices still languishing below the $55-$60/b that some ministers have said they are targeting, some market watchers say OPEC and its non-OPEC partners have no choice but to deepen cuts to make up for output gains from exempt Nigeria and Libya, as well as sliding compliance from other members.
2017, July, 21, 09:10:00
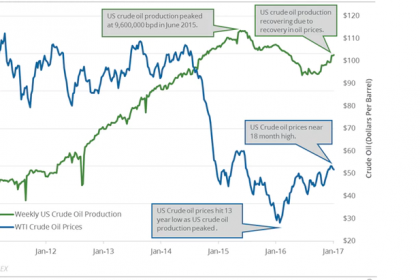
U.S. OIL PRODUCTION: 9.3 MBD
EIA forecasts that total U.S. crude oil production will average 9.3 million barrels per day (b/d) in 2017, up 0.5 million b/d from 2016. In 2018, crude oil production is expected to reach an average of 9.9 million b/d, which would surpass the previous record of 9.6 million b/d set in 1970.
2017, July, 19, 15:00:00
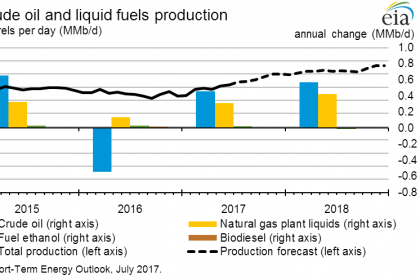
U.S. OIL&GAS PRODUCTION WILL UP
Crude oil production from the seven major US onshore regions is projected to rise 113,000 b/d month-over-month in August to 5.585 million b/d.
2017, July, 19, 14:55:00
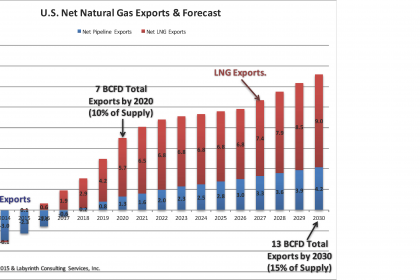
U.S. GLOBAL LEADERSHIP
While US demand for gas is rising because of higher industrial consumption, more than half of the production increase will be used for LNG for export. By 2022, IEA estimates that the US will be on course to challenge Australia and Qatar for global leadership among LNG exporters.
2017, July, 14, 09:45:00
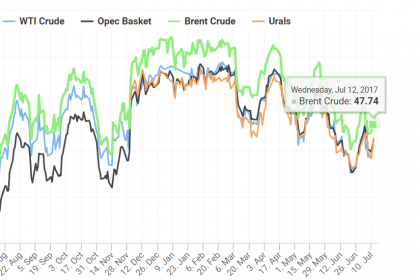
EIA OIL PRICES FORECASTS: $51 - $52
EIA now forecasts Brent crude oil spot prices to average $51 per barrel (b) in 2017 and $52/b in 2018. West Texas Intermediate (WTI) crude oil prices are expected to be $2/b lower than Brent prices in 2017 and 2018.
2017, July, 14, 09:40:00
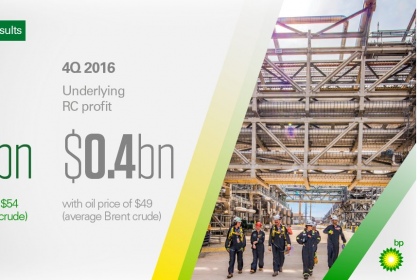
BP: EXCELLENCE, SUSTAINABILITY, COLLABORATION
I think there are three areas where we should focus our efforts.
The first is excellence in our operations, or as this session’s title puts it, leadership in responsible operations.
The second, is sustainability in our products - fully realising the benefits of both natural gas and renewables as well as our Downstream product range.
And the third is collaboration, or simply working together, in our partnerships - the kind of working together that makes new things happen and drives real change.
2017, July, 14, 09:35:00
U.S. OIL DEBT
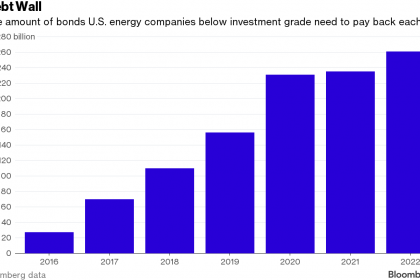
From 2012 through the end of 2015, debt was a significant source of capital for the producers included in the analysis, with the addition of a cumulative $55.3 billion in net debt. Since the beginning of 2016, however, these producers have reduced debt by $1.4 billion. The combination of higher equity and lower debt has resulted in the long-term debt-to-equity ratio, a measure of financial leverage, declining from 88% to 80% for the group of companies as a whole between the first quarter of 2016 and the first quarter of 2017.
2017, July, 12, 14:35:00
OIL PRICES: ABOVE $48
Oil prices rose more than 1 percent on Wednesday, extending gains from the previous day as the U.S. government cut its crude production outlook for next year and as fuel inventories plunged.
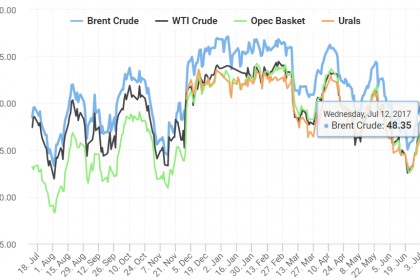
Brent crude futures were up 60 cents, or 1.3 percent, at $48.12 per barrel by 0657 GMT, while U.S. West Texas Intermediate (WTI) crude futures were at $45.72 per barrel, up 68 cents, or 1.5 percent.
2017, July, 12, 14:30:00
OIL&GAS PRICES FORECAST: $51-$52; $3.1-$3.4
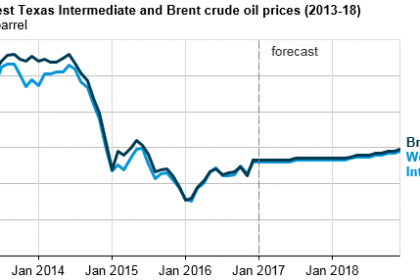
Brent crude oil prices are forecast to average $51/b in 2017 and $52/b in 2018. Average West Texas Intermediate (WTI) crude oil prices are forecast to be $2/b lower than the Brent price in both 2017 and 2018.
Henry Hub natural gas spot prices are forecast to average $3.10 per million British thermal units (MMBtu) in 2017 and $3.40/MMBtu in 2018.

2017, July, 12, 14:10:00
IEA: ENERGY INVESTMENT UPDOWN
Total energy investment worldwide in 2016 was just over $1.7 trillion, accounting for 2.2% of global GDP. Investment was down by 12% compared to IEA’s revised 2015 energy investment estimate of $1.9 trillion.
2017, July, 10, 12:25:00
ENERGY PRICES DOWN MORE
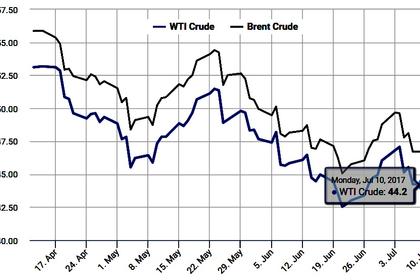
Because two major crude oil price benchmarks, West Texas Intermediate (WTI) and Brent, account for 70% of the weighting in the S&P GSCI energy index, the energy index tends to follow major price movements in the crude oil market. During the first half of 2017, WTI crude oil prices declined by 12%, while Brent prices fell 14%.
2017, July, 7, 07:50:00
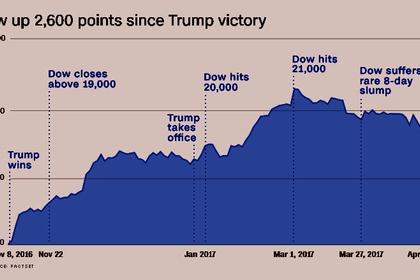
U.S. DEFICIT $46.5 BLN
The U.S. Census Bureau and the U.S. Bureau of Economic Analysis, through the Department of Commerce, announced today that the goods and services deficit was $46.5 billion in May, down $1.1 billion from $47.6 billion in April, revised. May exports were $192.0 billion, $0.9 billion more than April exports. May imports were $238.5 billion, $0.2 billion less than April imports.
2017, July, 3, 13:55:00
U.S. GAS UPDOWN
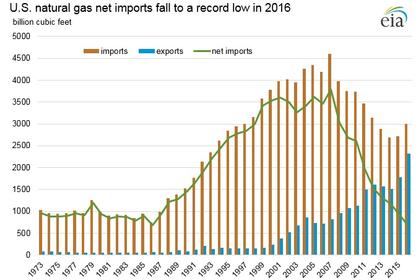
Natural gas net imports (imports minus exports) set a record low of 685 billion cubic feet (Bcf) in 2016, continuing a decline for the 9th consecutive year. In recent years both U.S. natural gas production and consumption have increased, although production has grown slightly faster, reducing the reliance on natural gas imports and lowering domestic prices.
2017, July, 3, 13:40:00
U.S. GDP UP 1.4%
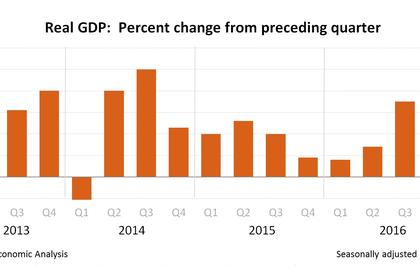
Real gross domestic product (GDP) increased at an annual rate of 1.4 percent in the first quarter of 2017 , according to the "third" estimate released by the Bureau of Economic Analysis. In the fourth quarter of 2016, real GDP increased 2.1 percent.
2017, July, 3, 13:30:00
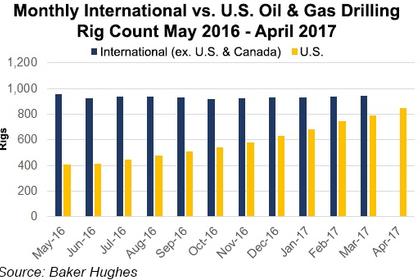
U.S. RIGS DOWN TO 940
U.S. Rig Count is up 509 rigs from last year's count of 431, with oil rigs up 415, gas rigs up 95, and miscellaneous rigs down 1 to 0.
Canadian Rig Count is up 113 rigs from last year's count of 76, with oil rigs up 77, gas rigs up 37, and miscellaneous rigs down 1 to 0.


